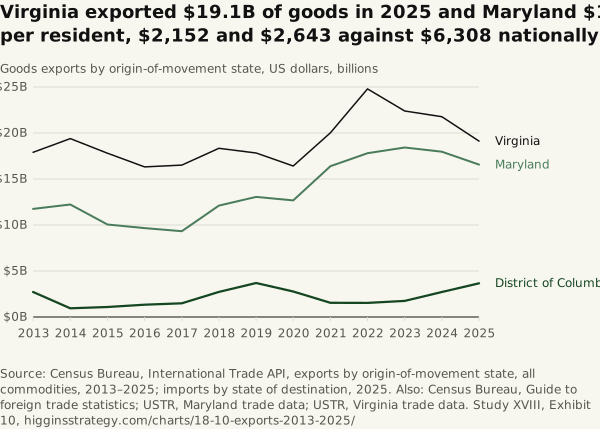
Virginia exported $19.1B of goods in 2025 and Maryland $16.6B; per resident, $2,152 and $2,643 against $6,308 nationally
Source. Census Bureau, International Trade API, exports by origin-of-movement state, all commodities, 2013–2025; imports by state of destination, 2025. Also: Census Bureau, Guide to foreign trade statistics; USTR, Maryland trade data; USTR, Virginia trade data.
Method and data
Method. Origin of movement is the state from which goods began their journey to the port, not necessarily where they were made; the District’s 2025 exports were led by transportation equipment, $1.4B of $3.7B (38%, NAICS 336), and computer and electronic products, $0.7B (NAICS 334). Imports are recorded by state of destination: in 2025, Virginia $43,618.6 million and Maryland $41,371.2 million. Per resident, 2025 exports ÷ BEA midyear population: Virginia $19,110.5 million ÷ 8,880,107 = $2,152; Maryland $16,561.4 million ÷ 6,265,347 = $2,643; the nation $2,155,904.4 million (the US total less Puerto Rico and the Virgin Islands) ÷ 341,784,857 = $6,308.
| Year | DC ($ billion) | Maryland | Virginia |
|---|---|---|---|
| 2013 | 2.71 | 11.75 | 17.90 |
| 2014 | 0.94 | 12.23 | 19.39 |
| 2015 | 1.09 | 10.05 | 17.80 |
| 2016 | 1.33 | 9.66 | 16.31 |
| 2017 | 1.48 | 9.32 | 16.51 |
| 2018 | 2.72 | 12.11 | 18.34 |
| 2019 | 3.69 | 13.05 | 17.83 |
| 2020 | 2.77 | 12.67 | 16.41 |
| 2021 | 1.53 | 16.39 | 20.01 |
| 2022 | 1.53 | 17.80 | 24.79 |
| 2023 | 1.75 | 18.42 | 22.39 |
| 2024 | 2.71 | 17.96 | 21.77 |
| 2025 | 3.66 | 16.56 | 19.11 |
Download SVG · CSV. Data and chart licensed CC BY 4.0.
Higgins Strategy. “Virginia exported $19.1B of goods in 2025 and Maryland $16.6B; per resident, $2,152 and $2,643 against $6,308 nationally” Exhibit 10, What the Region Makes (Study XVIII). October 12, 2026. https://higginsstrategy.com/charts/18-10-exports-2013-2025/