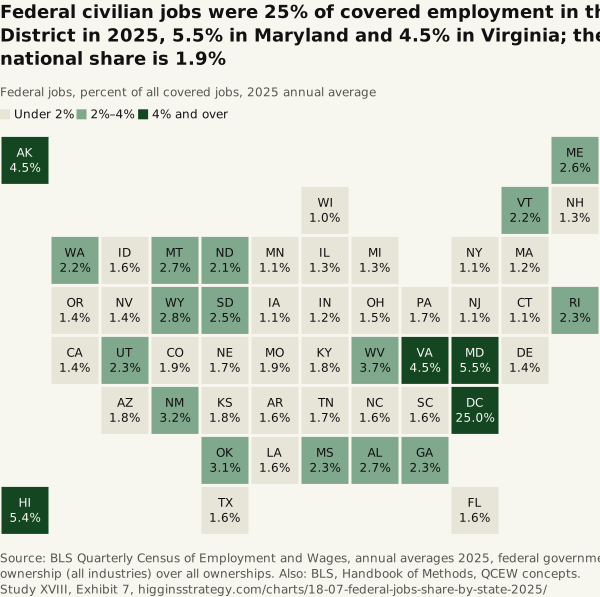
Federal civilian jobs were 25% of covered employment in the District in 2025, 5.5% in Maryland and 4.5% in Virginia; the national share is 1.9%
Source. BLS Quarterly Census of Employment and Wages, annual averages 2025, federal government ownership (all industries) over all ownerships. Also: BLS, Handbook of Methods, QCEW concepts.
Method and data
Method. Jobs covered by unemployment insurance, counted where the establishment is; federal workers who live in Maryland or Virginia and work in the District are counted in the District. The federal count excludes the uniformed military and a few agencies exempt from reporting. All covered jobs is BLS’s published total for all ownerships, which counts the state and local government jobs BLS does not publish separately for the District, South Dakota and Wyoming.
| State | Federal jobs, 2025 | All covered jobs | Federal share (%) | Rank |
|---|---|---|---|---|
| District of Columbia | 185,546 | 741,646 | 25.0 | 1 |
| Maryland | 151,248 | 2,754,961 | 5.5 | 2 |
| Hawaii | 34,913 | 644,391 | 5.4 | 3 |
| Virginia | 187,884 | 4,149,424 | 4.5 | 4 |
| Alaska | 14,839 | 332,544 | 4.5 | 5 |
| West Virginia | 25,638 | 695,422 | 3.7 | 6 |
| New Mexico | 28,435 | 875,212 | 3.2 | 7 |
| Oklahoma | 52,188 | 1,700,650 | 3.1 | 8 |
| Wyoming | 7,813 | 282,252 | 2.8 | 9 |
| Alabama | 56,757 | 2,118,878 | 2.7 | 10 |
| Montana | 13,685 | 512,424 | 2.7 | 11 |
| Maine | 17,230 | 651,181 | 2.6 | 12 |
| South Dakota | 11,378 | 460,392 | 2.5 | 13 |
| Utah | 40,236 | 1,741,066 | 2.3 | 14 |
| Rhode Island | 11,509 | 499,321 | 2.3 | 15 |
| Georgia | 110,569 | 4,890,150 | 2.3 | 16 |
| Mississippi | 26,505 | 1,173,251 | 2.3 | 17 |
| Vermont | 6,747 | 308,225 | 2.2 | 18 |
| Washington | 77,714 | 3,601,662 | 2.2 | 19 |
| North Dakota | 9,076 | 429,567 | 2.1 | 20 |
| Missouri | 54,850 | 2,898,452 | 1.9 | 21 |
| Colorado | 54,712 | 2,891,626 | 1.9 | 22 |
| Kansas | 25,939 | 1,432,626 | 1.8 | 23 |
| Arizona | 57,552 | 3,234,783 | 1.8 | 24 |
| Kentucky | 35,220 | 1,990,460 | 1.8 | 25 |
| Tennessee | 56,419 | 3,265,460 | 1.7 | 26 |
| Pennsylvania | 100,986 | 6,053,191 | 1.7 | 27 |
| Nebraska | 16,909 | 1,021,306 | 1.7 | 28 |
| North Carolina | 80,996 | 4,941,383 | 1.6 | 29 |
| Louisiana | 31,578 | 1,928,041 | 1.6 | 30 |
| Arkansas | 21,235 | 1,305,532 | 1.6 | 31 |
| South Carolina | 37,681 | 2,320,850 | 1.6 | 32 |
| Idaho | 14,025 | 874,283 | 1.6 | 33 |
| Florida | 158,330 | 9,914,411 | 1.6 | 34 |
| Texas | 222,523 | 14,109,957 | 1.6 | 35 |
| Ohio | 82,101 | 5,534,587 | 1.5 | 36 |
| Oregon | 28,283 | 1,987,730 | 1.4 | 37 |
| Nevada | 22,037 | 1,569,260 | 1.4 | 38 |
| Delaware | 6,585 | 481,552 | 1.4 | 39 |
| California | 247,845 | 18,210,243 | 1.4 | 40 |
| Illinois | 79,743 | 6,067,518 | 1.3 | 41 |
| New Hampshire | 8,884 | 689,026 | 1.3 | 42 |
| Michigan | 55,758 | 4,408,446 | 1.3 | 43 |
| Indiana | 39,348 | 3,190,325 | 1.2 | 44 |
| Massachusetts | 44,690 | 3,634,042 | 1.2 | 45 |
| Iowa | 17,851 | 1,558,465 | 1.1 | 46 |
| New York | 112,041 | 9,791,529 | 1.1 | 47 |
| New Jersey | 48,611 | 4,282,851 | 1.1 | 48 |
| Minnesota | 32,700 | 2,944,260 | 1.1 | 49 |
| Connecticut | 17,965 | 1,691,734 | 1.1 | 50 |
| Wisconsin | 30,207 | 2,945,816 | 1.0 | 51 |
| United States | 2,913,515 | 155,732,363 | 1.9 |
Download SVG · CSV. Data and chart licensed CC BY 4.0.
Higgins Strategy. “Federal civilian jobs were 25% of covered employment in the District in 2025, 5.5% in Maryland and 4.5% in Virginia; the national share is 1.9%” Exhibit 7, What the Region Makes (Study XVIII). October 12, 2026. https://higginsstrategy.com/charts/18-07-federal-jobs-share-by-state-2025/