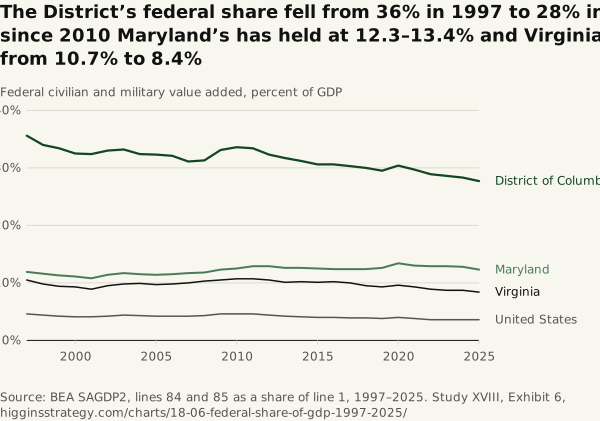
The District’s federal share fell from 36% in 1997 to 28% in 2025; since 2010 Maryland’s has held at 12.3–13.4% and Virginia’s fell from 10.7% to 8.4%
Source. BEA SAGDP2, lines 84 and 85 as a share of line 1, 1997–2025.
Method and data
Method. Lines 84 + 85 ÷ line 1, each year.
| Year | DC (%) | Maryland (%) | Virginia (%) | United States (%) |
|---|---|---|---|---|
| 1997 | 35.6 | 11.9 | 10.5 | 4.6 |
| 1998 | 34.0 | 11.6 | 9.8 | 4.4 |
| 1999 | 33.4 | 11.3 | 9.4 | 4.2 |
| 2000 | 32.5 | 11.1 | 9.3 | 4.1 |
| 2001 | 32.4 | 10.8 | 8.9 | 4.1 |
| 2002 | 33.0 | 11.4 | 9.5 | 4.2 |
| 2003 | 33.2 | 11.7 | 9.8 | 4.4 |
| 2004 | 32.4 | 11.5 | 9.9 | 4.3 |
| 2005 | 32.3 | 11.4 | 9.7 | 4.2 |
| 2006 | 32.1 | 11.5 | 9.8 | 4.2 |
| 2007 | 31.1 | 11.7 | 10.0 | 4.2 |
| 2008 | 31.3 | 11.8 | 10.3 | 4.3 |
| 2009 | 33.1 | 12.3 | 10.5 | 4.6 |
| 2010 | 33.6 | 12.5 | 10.7 | 4.6 |
| 2011 | 33.4 | 12.9 | 10.7 | 4.6 |
| 2012 | 32.3 | 12.9 | 10.5 | 4.4 |
| 2013 | 31.7 | 12.6 | 10.1 | 4.2 |
| 2014 | 31.2 | 12.6 | 10.2 | 4.1 |
| 2015 | 30.6 | 12.5 | 10.1 | 4.0 |
| 2016 | 30.6 | 12.4 | 10.2 | 4.0 |
| 2017 | 30.3 | 12.4 | 10.0 | 3.9 |
| 2018 | 30.0 | 12.4 | 9.5 | 3.9 |
| 2019 | 29.5 | 12.6 | 9.3 | 3.8 |
| 2020 | 30.4 | 13.4 | 9.6 | 4.0 |
| 2021 | 29.7 | 13.0 | 9.3 | 3.8 |
| 2022 | 28.9 | 12.9 | 8.9 | 3.6 |
| 2023 | 28.6 | 12.9 | 8.7 | 3.6 |
| 2024 | 28.3 | 12.8 | 8.7 | 3.6 |
| 2025 | 27.7 | 12.3 | 8.4 | 3.6 |
Download SVG · CSV. Data and chart licensed CC BY 4.0.
Higgins Strategy. “The District’s federal share fell from 36% in 1997 to 28% in 2025; since 2010 Maryland’s has held at 12.3–13.4% and Virginia’s fell from 10.7% to 8.4%” Exhibit 6, What the Region Makes (Study XVIII). October 12, 2026. https://higginsstrategy.com/charts/18-06-federal-share-of-gdp-1997-2025/