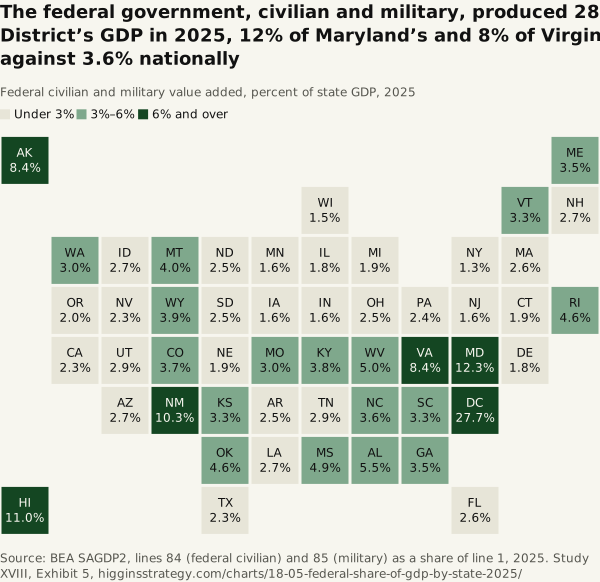
The federal government, civilian and military, produced 28% of the District’s GDP in 2025, 12% of Maryland’s and 8% of Virginia’s, against 3.6% nationally
Source. BEA SAGDP2, lines 84 (federal civilian) and 85 (military) as a share of line 1, 2025.
Method and data
Method. Value added by federal civilian agencies and the armed forces, which BEA measures mostly as compensation, divided by state GDP. It excludes federal contractors, whose output is counted in the private industries that employ them, so it understates federal dependence where contracting is large, as in Northern Virginia. Shares are computed on unrounded data.
| State | Federal civilian (% of GDP) | Military (%) | Federal total (%) | Rank |
|---|---|---|---|---|
| District of Columbia | 25.1 | 2.6 | 27.7 | 1 |
| Maryland | 10.1 | 2.2 | 12.3 | 2 |
| Hawaii | 5.3 | 5.8 | 11.0 | 3 |
| New Mexico | 6.5 | 3.8 | 10.3 | 4 |
| Virginia | 5.5 | 3.0 | 8.4 | 5 |
| Alaska | 3.9 | 4.5 | 8.4 | 6 |
| Alabama | 3.6 | 1.9 | 5.5 | 7 |
| West Virginia | 4.5 | 0.5 | 5.0 | 8 |
| Mississippi | 3.1 | 1.8 | 4.9 | 9 |
| Oklahoma | 3.2 | 1.4 | 4.6 | 10 |
| Rhode Island | 2.8 | 1.8 | 4.6 | 11 |
| Montana | 3.0 | 1.0 | 4.0 | 12 |
| Wyoming | 2.6 | 1.2 | 3.9 | 13 |
| Kentucky | 2.0 | 1.7 | 3.8 | 14 |
| Colorado | 2.3 | 1.4 | 3.7 | 15 |
| North Carolina | 1.9 | 1.7 | 3.6 | 16 |
| Maine | 3.1 | 0.5 | 3.5 | 17 |
| Georgia | 2.3 | 1.2 | 3.5 | 18 |
| Kansas | 1.7 | 1.6 | 3.3 | 19 |
| South Carolina | 1.9 | 1.4 | 3.3 | 20 |
| Vermont | 2.8 | 0.5 | 3.3 | 21 |
| Missouri | 2.2 | 0.8 | 3.0 | 22 |
| Washington | 1.9 | 1.1 | 3.0 | 23 |
| Tennessee | 2.5 | 0.4 | 2.9 | 24 |
| Utah | 2.3 | 0.6 | 2.9 | 25 |
| Arizona | 1.9 | 0.9 | 2.7 | 26 |
| New Hampshire | 1.7 | 1.0 | 2.7 | 27 |
| Idaho | 2.1 | 0.6 | 2.7 | 28 |
| Louisiana | 1.8 | 0.9 | 2.7 | 29 |
| Florida | 1.7 | 0.9 | 2.6 | 30 |
| Massachusetts | 1.6 | 1.0 | 2.6 | 31 |
| Ohio | 1.7 | 0.8 | 2.5 | 32 |
| Arkansas | 1.9 | 0.6 | 2.5 | 33 |
| North Dakota | 0.9 | 1.6 | 2.5 | 34 |
| South Dakota | 1.5 | 0.9 | 2.5 | 35 |
| Pennsylvania | 2.0 | 0.4 | 2.4 | 36 |
| Nevada | 1.4 | 0.9 | 2.3 | 37 |
| Texas | 1.5 | 0.8 | 2.3 | 38 |
| California | 1.4 | 0.8 | 2.3 | 39 |
| Oregon | 1.8 | 0.3 | 2.0 | 40 |
| Nebraska | 1.2 | 0.7 | 1.9 | 41 |
| Connecticut | 1.1 | 0.8 | 1.9 | 42 |
| Michigan | 1.6 | 0.3 | 1.9 | 43 |
| Illinois | 1.4 | 0.5 | 1.8 | 44 |
| Delaware | 1.1 | 0.7 | 1.8 | 45 |
| Indiana | 1.3 | 0.3 | 1.6 | 46 |
| New Jersey | 1.1 | 0.5 | 1.6 | 47 |
| Iowa | 1.1 | 0.5 | 1.6 | 48 |
| Minnesota | 1.2 | 0.4 | 1.6 | 49 |
| Wisconsin | 1.2 | 0.2 | 1.5 | 50 |
| New York | 1.1 | 0.3 | 1.3 | 51 |
| United States | 2.1 | 1.4 | 3.6 |
Download SVG · CSV. Data and chart licensed CC BY 4.0.
Higgins Strategy. “The federal government, civilian and military, produced 28% of the District’s GDP in 2025, 12% of Maryland’s and 8% of Virginia’s, against 3.6% nationally” Exhibit 5, What the Region Makes (Study XVIII). October 12, 2026. https://higginsstrategy.com/charts/18-05-federal-share-of-gdp-by-state-2025/