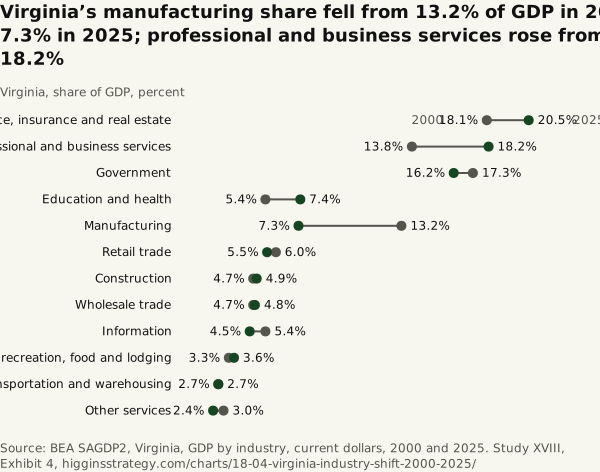
Virginia’s manufacturing share fell from 13.2% of GDP in 2000 to 7.3% in 2025; professional and business services rose from 13.8% to 18.2%
Source. BEA SAGDP2, Virginia, GDP by industry, current dollars, 2000 and 2025.
Method and data
Method. Industry value added ÷ all-industry GDP, 2000 and 2025; the change is computed on unrounded data.
| Industry | Share 2000 (%) | Share 2025 (%) | Change (points) |
|---|---|---|---|
| Finance, insurance and real estate | 18.1 | 20.5 | +2.4 |
| Professional and business services | 13.8 | 18.2 | +4.4 |
| Government | 17.3 | 16.2 | −1.2 |
| Education and health | 5.4 | 7.4 | +2.1 |
| Manufacturing | 13.2 | 7.3 | −5.9 |
| Retail trade | 6.0 | 5.5 | −0.6 |
| Construction | 4.7 | 4.9 | +0.1 |
| Wholesale trade | 4.7 | 4.8 | +0.2 |
| Information | 5.4 | 4.5 | −0.9 |
| Arts, recreation, food and lodging | 3.3 | 3.6 | +0.3 |
| Transportation and warehousing | 2.7 | 2.7 | 0.0 |
| Other services | 3.0 | 2.4 | −0.6 |
Download SVG · CSV. Data and chart licensed CC BY 4.0.
Higgins Strategy. “Virginia’s manufacturing share fell from 13.2% of GDP in 2000 to 7.3% in 2025; professional and business services rose from 13.8% to 18.2%” Exhibit 4, What the Region Makes (Study XVIII). October 12, 2026. https://higginsstrategy.com/charts/18-04-virginia-industry-shift-2000-2025/