Government is 30% of the District’s output and professional services 24%; finance and real estate lead Maryland and Virginia
Source. BEA SAGDP2, GDP by state by industry, current dollars, 2025.
Method and data
Method. Each industry group’s value added divided by all-industry GDP. Government includes federal civilian, military and state and local; real estate includes the imputed rent of owner-occupied housing, which is why it is large everywhere. The groups are BEA’s published industry groups; mining (1.3% of US GDP, 0.3% of Virginia’s) is not shown. The table carries them with 2000 for comparison.
| Industry | DC 2025 (%) | DC 2000 | Maryland 2025 | Maryland 2000 | Virginia 2025 | Virginia 2000 | US 2025 | US 2000 |
|---|---|---|---|---|---|---|---|---|
| Professional and business services | 24.0 | 21.6 | 14.0 | 11.9 | 18.2 | 13.8 | 12.8 | 10.8 |
| Finance, insurance and real estate | 14.4 | 12.8 | 20.3 | 19.9 | 20.5 | 18.1 | 22.4 | 19.3 |
| Government | 30.1 | 35.7 | 20.1 | 19.9 | 16.2 | 17.3 | 11.1 | 12.9 |
| Education and health | 8.0 | 7.3 | 9.2 | 7.9 | 7.4 | 5.4 | 8.7 | 6.8 |
| Manufacturing | 0.2 | 0.5 | 5.3 | 7.2 | 7.3 | 13.2 | 9.5 | 15.1 |
| Information | 7.3 | 5.8 | 4.0 | 4.1 | 4.5 | 5.4 | 5.7 | 4.6 |
| Wholesale trade | 1.4 | 1.0 | 5.2 | 5.5 | 4.8 | 4.7 | 6.3 | 6.1 |
| Retail trade | 1.2 | 1.3 | 5.4 | 6.7 | 5.5 | 6.0 | 5.9 | 6.7 |
| Construction | 1.0 | 1.2 | 5.9 | 5.6 | 4.9 | 4.7 | 4.3 | 4.5 |
| Arts, recreation, food and lodging | 4.4 | 4.2 | 4.1 | 4.0 | 3.6 | 3.3 | 4.2 | 3.8 |
| Transportation and warehousing | 0.4 | 0.7 | 2.3 | 2.3 | 2.7 | 2.7 | 3.3 | 3.0 |
| Other services | 6.6 | 6.6 | 2.3 | 3.0 | 2.4 | 3.0 | 2.0 | 2.7 |
| Utilities | 1.0 | 1.2 | 1.6 | 1.7 | 1.6 | 1.5 | 1.6 | 1.8 |
| Agriculture | 0.0 | 0.0 | 0.2 | 0.4 | 0.3 | 0.5 | 0.8 | 1.0 |
Download SVG · CSV. Data and chart licensed CC BY 4.0.
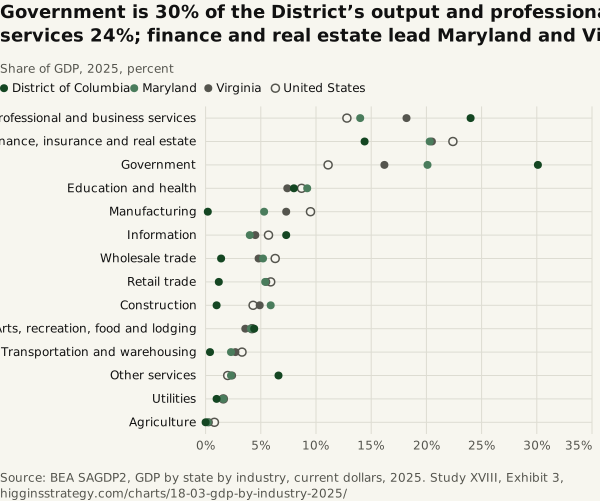
Higgins Strategy. “Government is 30% of the District’s output and professional services 24%; finance and real estate lead Maryland and Virginia” Exhibit 3, What the Region Makes (Study XVIII). October 12, 2026. https://higginsstrategy.com/charts/18-03-gdp-by-industry-2025/