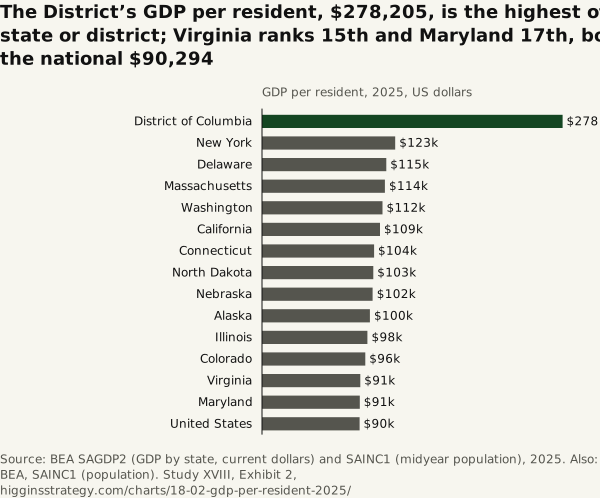
The District’s GDP per resident, $278,205, is the highest of any state or district; Virginia ranks 15th and Maryland 17th, both near the national $90,294
Source. BEA SAGDP2 (GDP by state, current dollars) and SAINC1 (midyear population), 2025. Also: BEA, SAINC1 (population).
Method and data
Method. Current-dollar GDP divided by midyear population. The District’s figure counts output produced in the city by workers who commute in, which is why it is not a measure of residents’ income; Exhibit 9 gives that.
| Area | GDP per resident, 2025 ($) | Rank of 51 |
|---|---|---|
| District of Columbia | 278,205 | 1 |
| New York | 123,273 | 2 |
| Delaware | 115,043 | 3 |
| Massachusetts | 113,724 | 4 |
| Washington | 111,518 | 5 |
| California | 109,196 | 6 |
| Connecticut | 103,727 | 7 |
| North Dakota | 103,020 | 8 |
| Nebraska | 102,386 | 9 |
| Alaska | 99,875 | 10 |
| Illinois | 97,568 | 11 |
| Colorado | 95,610 | 12 |
| New Jersey | 92,980 | 13 |
| Texas | 92,474 | 14 |
| Virginia | 90,981 | 15 |
| New Hampshire | 90,634 | 16 |
| Maryland | 90,501 | 17 |
| United States | 90,294 | |
| Utah | 90,191 | 18 |
| Wyoming | 89,157 | 19 |
| Minnesota | 88,350 | 20 |
| South Dakota | 87,694 | 21 |
| Hawaii | 85,959 | 22 |
| Nevada | 85,728 | 23 |
| Iowa | 83,973 | 24 |
| Georgia | 82,819 | 25 |
| Ohio | 82,087 | 26 |
| Pennsylvania | 80,898 | 27 |
| Oregon | 80,317 | 28 |
| Wisconsin | 80,160 | 29 |
| Tennessee | 80,137 | 30 |
| North Carolina | 80,007 | 31 |
| Rhode Island | 79,174 | 32 |
| Kansas | 77,961 | 33 |
| Indiana | 77,790 | 34 |
| Arizona | 77,665 | 35 |
| Vermont | 77,029 | 36 |
| Florida | 76,958 | 37 |
| Missouri | 75,811 | 38 |
| Louisiana | 74,125 | 39 |
| Michigan | 72,462 | 40 |
| Maine | 71,898 | 41 |
| New Mexico | 71,569 | 42 |
| Montana | 70,713 | 43 |
| Kentucky | 68,065 | 44 |
| South Carolina | 67,929 | 45 |
| Idaho | 67,695 | 46 |
| Oklahoma | 66,523 | 47 |
| Alabama | 65,286 | 48 |
| West Virginia | 63,020 | 49 |
| Arkansas | 62,922 | 50 |
| Mississippi | 55,117 | 51 |
Download SVG · CSV. Data and chart licensed CC BY 4.0.
Higgins Strategy. “The District’s GDP per resident, $278,205, is the highest of any state or district; Virginia ranks 15th and Maryland 17th, both near the national $90,294” Exhibit 2, What the Region Makes (Study XVIII). October 12, 2026. https://higginsstrategy.com/charts/18-02-gdp-per-resident-2025/