Since 2000 Virginia’s economy grew 69% in real terms and the nation’s 70%; Maryland’s grew 62% and the District’s 58%
Source. BEA, Regional Economic Accounts, SAGDP9, real GDP by state, chained 2017 dollars, 2000–2025. Also: BEA, state GDP release of September 30, 2026; BEA, state GDP release of April 9, 2026.
Method and data
Method. Real GDP in each year divided by its 2000 value, times 100. 2025 reflects BEA’s annual update of September 30, 2026; BEA’s first estimate for 2025 (April 9, 2026) showed the District growing. The District fell 1.0% from 2024 to 2025 while the nation grew 2.3%.
| Year | DC (2000 = 100) | Maryland | Virginia | United States |
|---|---|---|---|---|
| 2000 | 100.0 | 100.0 | 100.0 | 100.0 |
| 2001 | 103.7 | 104.4 | 103.6 | 101.0 |
| 2002 | 106.7 | 107.8 | 104.6 | 102.7 |
| 2003 | 108.8 | 110.5 | 108.5 | 105.5 |
| 2004 | 114.9 | 115.7 | 113.1 | 109.6 |
| 2005 | 117.4 | 120.9 | 118.5 | 113.4 |
| 2006 | 117.3 | 122.5 | 121.0 | 116.6 |
| 2007 | 121.0 | 123.2 | 122.7 | 118.9 |
| 2008 | 125.3 | 125.6 | 123.9 | 119.1 |
| 2009 | 124.7 | 124.9 | 123.4 | 116.0 |
| 2010 | 129.8 | 130.9 | 127.6 | 119.1 |
| 2011 | 132.2 | 133.7 | 128.6 | 121.0 |
| 2012 | 133.2 | 134.3 | 129.5 | 123.7 |
| 2013 | 133.8 | 135.4 | 131.1 | 126.4 |
| 2014 | 136.8 | 137.5 | 131.1 | 129.6 |
| 2015 | 139.2 | 140.6 | 133.8 | 133.4 |
| 2016 | 142.5 | 145.5 | 135.4 | 135.8 |
| 2017 | 144.8 | 148.4 | 138.1 | 139.1 |
| 2018 | 148.8 | 149.4 | 141.5 | 143.3 |
| 2019 | 149.7 | 149.5 | 145.1 | 147.0 |
| 2020 | 148.4 | 144.3 | 143.5 | 143.9 |
| 2021 | 155.2 | 151.6 | 151.6 | 152.9 |
| 2022 | 156.6 | 154.1 | 155.6 | 156.6 |
| 2023 | 156.1 | 155.8 | 161.4 | 161.2 |
| 2024 | 159.9 | 161.1 | 165.6 | 166.0 |
| 2025 | 158.3 | 162.4 | 169.5 | 169.9 |
Download SVG · CSV. Data and chart licensed CC BY 4.0.
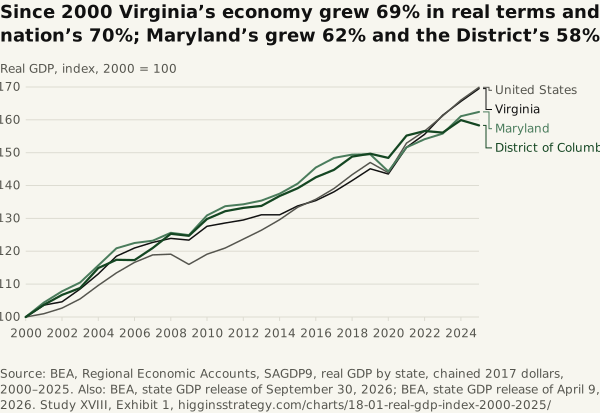
Higgins Strategy. “Since 2000 Virginia’s economy grew 69% in real terms and the nation’s 70%; Maryland’s grew 62% and the District’s 58%” Exhibit 1, What the Region Makes (Study XVIII). October 12, 2026. https://higginsstrategy.com/charts/18-01-real-gdp-index-2000-2025/