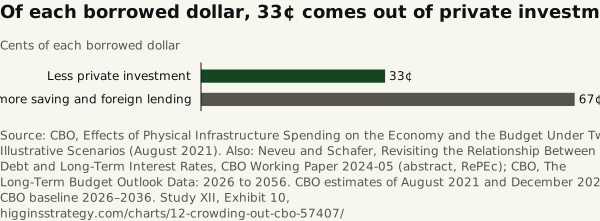
Of each borrowed dollar, 33¢ comes out of private investment
Source. CBO, Effects of Physical Infrastructure Spending on the Economy and the Budget Under Two Illustrative Scenarios (August 2021). Also: Neveu and Schafer, Revisiting the Relationship Between Debt and Long-Term Interest Rates, CBO Working Paper 2024-05 (abstract, RePEc); CBO, The Long-Term Budget Outlook Data: 2026 to 2056. CBO estimates of August 2021 and December 2024; CBO baseline 2026–2036.
Method and data
Method. CBO: “for each dollar that the federal deficit increased, domestic private investment would fall by 33 cents.” The other 67 cents is the remainder (100 − 33); CBO does not split it between more saving and foreign lending. Each percentage point of debt to GDP raises long-term interest rates (the 10-year Treasury rate) by about 2 basis points (Neveu and Schafer, CBO Working Paper 2024-05). On CBO’s baseline, debt held by the public goes from 100.6% of GDP in 2026 to 120.2% in 2036, 19.6 points at 2 basis points each, 39 basis points: about 0.4 points on the ten-year Treasury rate.
| Of each borrowed dollar | Cents |
|---|---|
| Less private investment | 33 |
| From more saving and foreign lending | 67 |
Download SVG · CSV. Data and chart licensed CC BY 4.0.
Higgins Strategy. “Of each borrowed dollar, 33¢ comes out of private investment” Exhibit 10, The Interest Bill (Study XII). October 12, 2026. https://higginsstrategy.com/charts/12-crowding-out-cbo-57407/