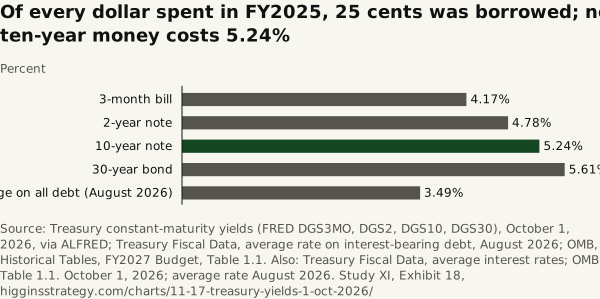
Of every dollar spent in FY2025, 25 cents was borrowed; new ten-year money costs 5.24%
Source. Treasury constant-maturity yields (FRED DGS3MO, DGS2, DGS10, DGS30), October 1, 2026, via ALFRED; Treasury Fiscal Data, average rate on interest-bearing debt, August 2026; OMB, Historical Tables, FY2027 Budget, Table 1.1. Also: Treasury Fiscal Data, average interest rates; OMB, Table 1.1. October 1, 2026; average rate August 2026.
Method and data
Method. Borrowed share = the FY2025 deficit ÷ outlays = $1,774.7 billion ÷ $7,011.1 billion = 25.3 cents of every dollar; receipts $5,236.4 billion paid the rest (the CSV linked below). Yields are the constant-maturity rates for October 1, 2026; new borrowing is priced at them, not at the 3.49% average on the debt already outstanding. FY2025 outlays, receipts and deficit (CSV).
| Security | Yield (%) |
|---|---|
| 3-month bill | 4.17 |
| 2-year note | 4.78 |
| 10-year note | 5.24 |
| 30-year bond | 5.61 |
| Average on all debt (August 2026) | 3.49 |
Download SVG · CSV. Data and chart licensed CC BY 4.0.
Higgins Strategy. “Of every dollar spent in FY2025, 25 cents was borrowed; new ten-year money costs 5.24%” Exhibit 18, Five Thousand Dollars Each (Study XI). October 12, 2026. https://higginsstrategy.com/charts/11-17-treasury-yields-1-oct-2026/