A household’s payment is a third of a year’s income at the bottom and 2% at the top
Source. CBO, The Distribution of Household Income, 2022 (January 2026), supplemental data, Table 3 (saved by hand from cbo.gov); Census Bureau, ACS 2024 1-year, Tables B29001 and B11001. Also: ACS 2024 1-year, B29001; ACS 2024 1-year, B11001; New York Fed, Liberty Street Economics. Incomes 2022 (2022 dollars); households 2024.
Method and data
Method. A household’s payment = $5,000 × 245,275,126 adult citizens ÷ 132,737,146 households (ACS 2024 1-year) = $9,239, about 1.85 adult citizens per household, divided by CBO’s average income before transfers and taxes for each fifth of households (2022, in 2022 dollars). The New York Fed publishes spending shares by income band, not by fifth: in the second round, households under $40,000 spent or expected to spend 27% and households over $75,000 24% (debt 44% and 32%).
| Households | Average income before transfers and taxes | Payment as % of income |
|---|---|---|
| Lowest fifth | 26,200 | 35.3 |
| Second fifth | 59,100 | 15.6 |
| Middle fifth | 94,000 | 9.8 |
| Fourth fifth | 143,100 | 6.5 |
| Highest fifth | 412,600 | 2.2 |
Download SVG · CSV. Data and chart licensed CC BY 4.0.
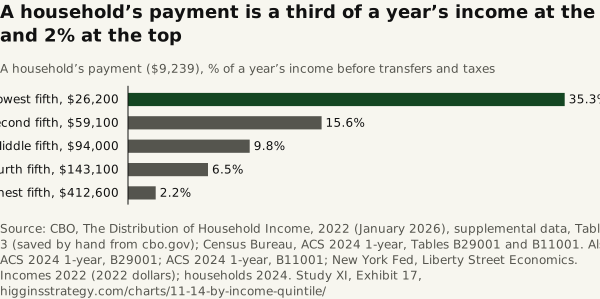
Higgins Strategy. “A household’s payment is a third of a year’s income at the bottom and 2% at the top” Exhibit 17, Five Thousand Dollars Each (Study XI). October 12, 2026. https://higginsstrategy.com/charts/11-14-by-income-quintile/