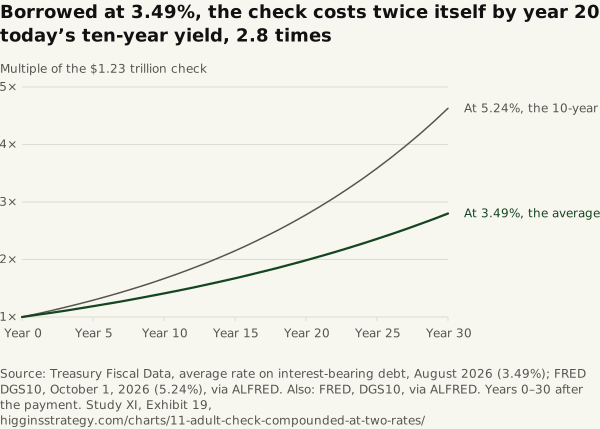
Borrowed at 3.49%, the check costs twice itself by year 20; at today’s ten-year yield, 2.8 times
Source. Treasury Fiscal Data, average rate on interest-bearing debt, August 2026 (3.49%); FRED DGS10, October 1, 2026 (5.24%), via ALFRED. Also: FRED, DGS10, via ALFRED. Years 0–30 after the payment.
Method and data
Method. Total cost = $1,226.4 billion × (1 + rate)^year, the interest rolled over annually and the rate held constant; not a forecast. The headline is the 3.49% average on existing debt: ×1.41 ($1.73 trillion) by year 10, ×1.99 ($2.44 trillion) by year 20, ×2.8 ($3.43 trillion) by year 30. The alternative is the 10-year yield, what new borrowing costs: ×1.67, ×2.78 and ×4.63 ($5.68 trillion).
| Year | Multiple at 3.49% | Cost at 3.49% ($bn) | Multiple at 5.24% | Cost at 5.24% ($bn) |
|---|---|---|---|---|
| 0 | 1.00 | 1,226.4 | 1.00 | 1,226.4 |
| 1 | 1.03 | 1,269.2 | 1.05 | 1,290.6 |
| 2 | 1.07 | 1,313.5 | 1.11 | 1,358.3 |
| 3 | 1.11 | 1,359.3 | 1.17 | 1,429.4 |
| 4 | 1.15 | 1,406.8 | 1.23 | 1,504.3 |
| 5 | 1.19 | 1,455.8 | 1.29 | 1,583.2 |
| 6 | 1.23 | 1,506.7 | 1.36 | 1,666.1 |
| 7 | 1.27 | 1,559.2 | 1.43 | 1,753.4 |
| 8 | 1.32 | 1,613.7 | 1.50 | 1,845.3 |
| 9 | 1.36 | 1,670.0 | 1.58 | 1,942.0 |
| 10 | 1.41 | 1,728.3 | 1.67 | 2,043.8 |
| 11 | 1.46 | 1,788.6 | 1.75 | 2,150.9 |
| 12 | 1.51 | 1,851.0 | 1.85 | 2,263.6 |
| 13 | 1.56 | 1,915.6 | 1.94 | 2,382.2 |
| 14 | 1.62 | 1,982.4 | 2.04 | 2,507.0 |
| 15 | 1.67 | 2,051.6 | 2.15 | 2,638.4 |
| 16 | 1.73 | 2,123.2 | 2.26 | 2,776.6 |
| 17 | 1.79 | 2,197.3 | 2.38 | 2,922.1 |
| 18 | 1.85 | 2,274.0 | 2.51 | 3,075.2 |
| 19 | 1.92 | 2,353.4 | 2.64 | 3,236.4 |
| 20 | 1.99 | 2,435.5 | 2.78 | 3,406.0 |
| 21 | 2.06 | 2,520.5 | 2.92 | 3,584.4 |
| 22 | 2.13 | 2,608.5 | 3.08 | 3,772.3 |
| 23 | 2.20 | 2,699.5 | 3.24 | 3,969.9 |
| 24 | 2.28 | 2,793.7 | 3.41 | 4,178.0 |
| 25 | 2.36 | 2,891.2 | 3.58 | 4,396.9 |
| 26 | 2.44 | 2,992.1 | 3.77 | 4,627.3 |
| 27 | 2.52 | 3,096.6 | 3.97 | 4,869.7 |
| 28 | 2.61 | 3,204.6 | 4.18 | 5,124.9 |
| 29 | 2.70 | 3,316.5 | 4.40 | 5,393.5 |
| 30 | 2.80 | 3,432.2 | 4.63 | 5,676.1 |
Download SVG · CSV. Data and chart licensed CC BY 4.0.
Higgins Strategy. “Borrowed at 3.49%, the check costs twice itself by year 20; at today’s ten-year yield, 2.8 times” Exhibit 19, Five Thousand Dollars Each (Study XI). October 12, 2026. https://higginsstrategy.com/charts/11-adult-check-compounded-at-two-rates/