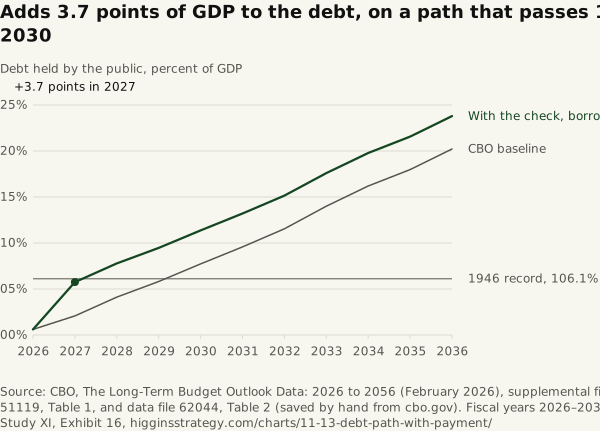
Adds 3.7 points of GDP to the debt, on a path that passes 1946 in 2030
Source. CBO, The Long-Term Budget Outlook Data: 2026 to 2056 (February 2026), supplemental file 51119, Table 1, and data file 62044, Table 2 (saved by hand from cbo.gov). Fiscal years 2026–2036.
Method and data
Method. Debt held by the public as a share of GDP, CBO’s extended baseline, and the same path with $1,226.4 billion borrowed in 2027 and its interest rolled over at a constant 3.49%: baseline + $1,226.4 billion × 1.0349^(year − 2027) ÷ CBO’s GDP for the year. CBO’s GDP is held fixed (no effect of the payment on the economy). A calculation on CBO’s published baseline, not a CBO estimate. The 1946 record is 106.1% (Table 2); the baseline is 105.811% in 2029 and 107.726% in 2030.
| Fiscal year | CBO baseline (%) | With the check (%) |
|---|---|---|
| 2,026 | 100.6 | 100.6 |
| 2,027 | 102.1 | 105.8 |
| 2,028 | 104.1 | 107.8 |
| 2,029 | 105.8 | 109.5 |
| 2,030 | 107.7 | 111.4 |
| 2,031 | 109.6 | 113.2 |
| 2,032 | 111.5 | 115.2 |
| 2,033 | 114.0 | 117.6 |
| 2,034 | 116.2 | 119.8 |
| 2,035 | 118.0 | 121.6 |
| 2,036 | 120.2 | 123.8 |
Download SVG · CSV. Data and chart licensed CC BY 4.0.
Higgins Strategy. “Adds 3.7 points of GDP to the debt, on a path that passes 1946 in 2030” Exhibit 16, Five Thousand Dollars Each (Study XI). October 12, 2026. https://higginsstrategy.com/charts/11-13-debt-path-with-payment/