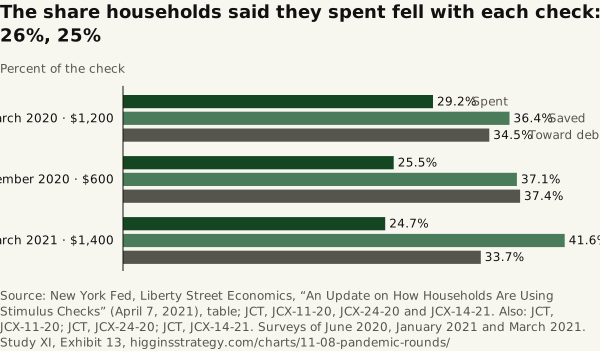
The share households said they spent fell with each check: 29%, 26%, 25%
Source. New York Fed, Liberty Street Economics, “An Update on How Households Are Using Stimulus Checks” (April 7, 2021), table; JCT, JCX-11-20, JCX-24-20 and JCX-14-21. Also: JCT, JCX-11-20; JCT, JCX-24-20; JCT, JCX-14-21. Surveys of June 2020, January 2021 and March 2021.
Method and data
Method. Average shares households reported having spent or expecting to spend, save and use to pay down debt, by round, as the New York Fed published them; rounds 2 and 3 rest on 1,062 and 1,007 respondents who received or expected to receive the payment, and only 32% of households had received the third by the March survey. JCT’s scores are for the enacted bills, $ billions over ten years.
| Round | Survey | Spent (%) | Saved (%) | Debt (%) | JCT score ($bn) |
|---|---|---|---|---|---|
| March 2020 · $1,200 | June 2020 | 29.2 | 36.4 | 34.5 | 292.4 |
| December 2020 · $600 | January 2021 | 25.5 | 37.1 | 37.4 | 164.1 |
| March 2021 · $1,400 | March 2021 | 24.7 | 41.6 | 33.7 | 410.6 |
Download SVG · CSV. Data and chart licensed CC BY 4.0.
Higgins Strategy. “The share households said they spent fell with each check: 29%, 26%, 25%” Exhibit 13, Five Thousand Dollars Each (Study XI). October 12, 2026. https://higginsstrategy.com/charts/11-08-pandemic-rounds/