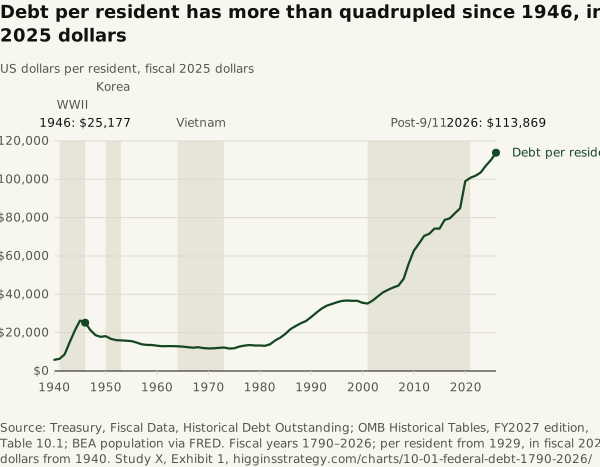
Debt per resident has more than quadrupled since 1946, in fiscal 2025 dollars
Source. Treasury, Fiscal Data, Historical Debt Outstanding; OMB Historical Tables, FY2027 edition, Table 10.1; BEA population via FRED. Fiscal years 1790–2026; per resident from 1929, in fiscal 2025 dollars from 1940.
Method and data
Method. Total public debt outstanding at each fiscal year-end (June 30 to 1976, September 30 since 1977), from Treasury’s Historical Debt Outstanding; the FY2026 figure is September 30, 2026. The 1843 entry appears twice because the fiscal year changed; the later value is used. It is slightly larger than OMB’s “gross federal debt” (which excludes some agency debt and uses accrual values); the two are shown on their own bases and not mixed. Per resident divides by BEA’s annual population (1929 onward; earlier years omitted); FY2026 divides by the January–August 2026 average of Census monthly population (342,739 thousand). Fiscal 2025 dollars use OMB’s GDP price index (Table 10.1, 1940 onward; FY2026 on OMB’s estimate). Current-dollar debt for every year from 1790 is in the table and the CSV, in billions to three decimals, so 1835 ($33,733.05) and 1836 ($37,513.05) show as 0.000.
| Fiscal year | Debt ($bn, current) | Per resident ($, FY2025) |
|---|---|---|
| 1790 | 0.071 | |
| 1791 | 0.075 | |
| 1792 | 0.077 | |
| 1793 | 0.080 | |
| 1794 | 0.078 | |
| 1795 | 0.081 | |
| 1796 | 0.084 | |
| 1797 | 0.082 | |
| 1798 | 0.079 | |
| 1799 | 0.078 | |
| 1800 | 0.083 | |
| 1801 | 0.083 | |
| 1802 | 0.081 | |
| 1803 | 0.077 | |
| 1804 | 0.086 | |
| 1805 | 0.082 | |
| 1806 | 0.076 | |
| 1807 | 0.069 | |
| 1808 | 0.065 | |
| 1809 | 0.057 | |
| 1810 | 0.053 | |
| 1811 | 0.048 | |
| 1812 | 0.045 | |
| 1813 | 0.056 | |
| 1814 | 0.081 | |
| 1815 | 0.100 | |
| 1816 | 0.127 | |
| 1817 | 0.123 | |
| 1818 | 0.103 | |
| 1819 | 0.096 | |
| 1820 | 0.091 | |
| 1821 | 0.090 | |
| 1822 | 0.094 | |
| 1823 | 0.091 | |
| 1824 | 0.090 | |
| 1825 | 0.084 | |
| 1826 | 0.081 | |
| 1827 | 0.074 | |
| 1828 | 0.067 | |
| 1829 | 0.058 | |
| 1830 | 0.049 | |
| 1831 | 0.039 | |
| 1832 | 0.024 | |
| 1833 | 0.007 | |
| 1834 | 0.005 | |
| 1835 | 0.000 | |
| 1836 | 0.000 | |
| 1837 | 0.000 | |
| 1838 | 0.003 | |
| 1839 | 0.010 | |
| 1840 | 0.004 | |
| 1841 | 0.005 | |
| 1842 | 0.014 | |
| 1843 | 0.033 | |
| 1844 | 0.023 | |
| 1845 | 0.016 | |
| 1846 | 0.016 | |
| 1847 | 0.039 | |
| 1848 | 0.047 | |
| 1849 | 0.063 | |
| 1850 | 0.063 | |
| 1851 | 0.068 | |
| 1852 | 0.066 | |
| 1853 | 0.060 | |
| 1854 | 0.042 | |
| 1855 | 0.036 | |
| 1856 | 0.032 | |
| 1857 | 0.029 | |
| 1858 | 0.045 | |
| 1859 | 0.058 | |
| 1860 | 0.065 | |
| 1861 | 0.091 | |
| 1862 | 0.524 | |
| 1863 | 1.120 | |
| 1864 | 1.816 | |
| 1865 | 2.681 | |
| 1866 | 2.773 | |
| 1867 | 2.678 | |
| 1868 | 2.612 | |
| 1869 | 2.588 | |
| 1870 | 2.481 | |
| 1871 | 2.353 | |
| 1872 | 2.253 | |
| 1873 | 2.234 | |
| 1874 | 2.252 | |
| 1875 | 2.232 | |
| 1876 | 2.180 | |
| 1877 | 2.205 | |
| 1878 | 2.256 | |
| 1879 | 2.350 | |
| 1880 | 2.120 | |
| 1881 | 2.069 | |
| 1882 | 1.918 | |
| 1883 | 1.884 | |
| 1884 | 1.831 | |
| 1885 | 1.864 | |
| 1886 | 1.775 | |
| 1887 | 1.658 | |
| 1888 | 1.693 | |
| 1889 | 1.619 | |
| 1890 | 1.552 | |
| 1891 | 1.546 | |
| 1892 | 1.588 | |
| 1893 | 1.546 | |
| 1894 | 1.632 | |
| 1895 | 1.676 | |
| 1896 | 1.770 | |
| 1897 | 1.818 | |
| 1898 | 1.797 | |
| 1899 | 1.992 | |
| 1900 | 2.137 | |
| 1901 | 2.143 | |
| 1902 | 2.159 | |
| 1903 | 2.202 | |
| 1904 | 2.264 | |
| 1905 | 2.275 | |
| 1906 | 2.337 | |
| 1907 | 2.457 | |
| 1908 | 2.627 | |
| 1909 | 2.640 | |
| 1910 | 2.653 | |
| 1911 | 2.766 | |
| 1912 | 2.868 | |
| 1913 | 2.916 | |
| 1914 | 2.912 | |
| 1915 | 3.058 | |
| 1916 | 3.609 | |
| 1917 | 5.718 | |
| 1918 | 14.592 | |
| 1919 | 27.391 | |
| 1920 | 25.952 | |
| 1921 | 23.977 | |
| 1922 | 22.963 | |
| 1923 | 22.350 | |
| 1924 | 21.251 | |
| 1925 | 20.516 | |
| 1926 | 19.643 | |
| 1927 | 18.512 | |
| 1928 | 17.604 | |
| 1929 | 16.931 | |
| 1930 | 16.185 | |
| 1931 | 16.801 | |
| 1932 | 19.487 | |
| 1933 | 22.539 | |
| 1934 | 27.053 | |
| 1935 | 28.701 | |
| 1936 | 33.779 | |
| 1937 | 36.425 | |
| 1938 | 37.165 | |
| 1939 | 40.440 | |
| 1940 | 42.968 | 5,823 |
| 1941 | 48.961 | 6,333 |
| 1942 | 72.422 | 8,630 |
| 1943 | 136.696 | 15,084 |
| 1944 | 201.003 | 21,146 |
| 1945 | 258.682 | 26,291 |
| 1946 | 269.422 | 25,177 |
| 1947 | 258.286 | 21,352 |
| 1948 | 252.292 | 18,730 |
| 1949 | 252.770 | 17,839 |
| 1950 | 257.357 | 18,117 |
| 1951 | 255.222 | 16,758 |
| 1952 | 259.105 | 16,078 |
| 1953 | 266.071 | 15,950 |
| 1954 | 271.260 | 15,790 |
| 1955 | 274.374 | 15,578 |
| 1956 | 272.751 | 14,836 |
| 1957 | 270.527 | 13,927 |
| 1958 | 276.343 | 13,583 |
| 1959 | 284.706 | 13,550 |
| 1960 | 286.331 | 13,172 |
| 1961 | 288.971 | 12,903 |
| 1962 | 298.201 | 12,979 |
| 1963 | 305.860 | 12,966 |
| 1964 | 311.713 | 12,881 |
| 1965 | 317.274 | 12,727 |
| 1966 | 319.907 | 12,415 |
| 1967 | 326.221 | 12,155 |
| 1968 | 347.578 | 12,387 |
| 1969 | 353.720 | 11,937 |
| 1970 | 370.919 | 11,749 |
| 1971 | 398.130 | 11,848 |
| 1972 | 427.260 | 12,008 |
| 1973 | 458.142 | 12,226 |
| 1974 | 475.060 | 11,726 |
| 1975 | 533.189 | 11,811 |
| 1976 | 620.433 | 12,726 |
| 1977 | 698.840 | 13,233 |
| 1978 | 771.544 | 13,546 |
| 1979 | 826.519 | 13,278 |
| 1980 | 907.701 | 13,258 |
| 1981 | 997.855 | 13,142 |
| 1982 | 1,142.034 | 13,929 |
| 1983 | 1,377.210 | 15,950 |
| 1984 | 1,572.266 | 17,425 |
| 1985 | 1,823.103 | 19,379 |
| 1986 | 2,125.303 | 21,894 |
| 1987 | 2,350.277 | 23,472 |
| 1988 | 2,602.338 | 24,944 |
| 1989 | 2,857.431 | 26,079 |
| 1990 | 3,233.313 | 28,151 |
| 1991 | 3,665.303 | 30,404 |
| 1992 | 4,064.621 | 32,459 |
| 1993 | 4,411.489 | 33,977 |
| 1994 | 4,692.750 | 34,945 |
| 1995 | 4,973.983 | 35,844 |
| 1996 | 5,224.811 | 36,527 |
| 1997 | 5,413.146 | 36,742 |
| 1998 | 5,526.193 | 36,616 |
| 1999 | 5,656.271 | 36,599 |
| 2000 | 5,674.178 | 35,575 |
| 2001 | 5,807.463 | 35,197 |
| 2002 | 6,228.236 | 36,810 |
| 2003 | 6,783.231 | 38,974 |
| 2004 | 7,379.053 | 41,015 |
| 2005 | 7,932.710 | 42,395 |
| 2006 | 8,506.974 | 43,617 |
| 2007 | 9,007.653 | 44,518 |
| 2008 | 10,024.725 | 48,084 |
| 2009 | 11,909.829 | 56,051 |
| 2010 | 13,561.623 | 62,746 |
| 2011 | 14,790.340 | 66,557 |
| 2012 | 16,066.241 | 70,462 |
| 2013 | 16,738.184 | 71,561 |
| 2014 | 17,824.071 | 74,252 |
| 2015 | 18,150.618 | 74,254 |
| 2016 | 19,573.445 | 78,828 |
| 2017 | 20,244.900 | 79,627 |
| 2018 | 21,516.058 | 82,302 |
| 2019 | 22,719.402 | 84,900 |
| 2020 | 26,945.391 | 98,986 |
| 2021 | 28,428.919 | 100,796 |
| 2022 | 30,928.912 | 101,853 |
| 2023 | 33,167.334 | 103,549 |
| 2024 | 35,464.674 | 107,026 |
| 2025 | 37,637.553 | 110,069 |
| 2026 | 40,171.825 | 113,869 |
Download SVG · CSV. Data and chart licensed CC BY 4.0.
Higgins Strategy. “Debt per resident has more than quadrupled since 1946, in fiscal 2025 dollars” Exhibit 1, The Debt, the Waste and the Tax (Study X). October 12, 2026. https://higginsstrategy.com/charts/10-01-federal-debt-1790-2026/