Disability compensation, pensions and medical care were nine-tenths of the veterans line in 2025
Source. OMB Historical Tables, FY2027 edition (April 2026), Table 3.2; Table 10.1; BEA population via FRED; CBO, The Demographic Outlook: 2026 to 2056 (January 2026), Figure 1. Fiscal years 1962–2025, with OMB estimates to 2031.
Method and data
Method. Disability compensation and pensions (701) and medical care (703) are nine-tenths of the line; the GI Bill (702) peaks after each war. The line rose from $983 per resident in 2024 to $1,103 in 2025. OMB Table 3.2. FY2027–2031 per resident: OMB’s estimates divided by the 2026 population (342,739 thousand, the January–August 2026 average of Census monthly population, as in Exhibit 1) grown at CBO’s projected rates for the Social Security area population (CBO, The Demographic Outlook: 2026 to 2056, January 2026, Figure 1: 0.253%, 0.259%, 0.275%, 0.29%, 0.3%); a calculation from published figures. Each rate is CBO’s growth over one calendar year, so the 2026 rate gives FY2027 and so on to the 2030 rate for FY2031, each year rounded to the thousand before the next is grown: 343,606, 344,496, 345,443, 346,445 and 347,484 thousand.
| Fiscal year (2026–31 OMB estimates) | Income (701) | Medical (703) | Education (702) | Housing (704) | Other (705) |
|---|---|---|---|---|---|
| 1962 | 173 | 47 | 7 | 11 | 7 |
| 1963 | 179 | 49 | 4 | −4 | 7 |
| 1964 | 172 | 51 | 3 | 2 | 7 |
| 1965 | 169 | 51 | 2 | 0 | 7 |
| 1966 | 163 | 51 | 2 | 7 | 7 |
| 1967 | 170 | 52 | 11 | 11 | 7 |
| 1968 | 167 | 52 | 17 | 8 | 8 |
| 1969 | 170 | 53 | 23 | 4 | 8 |
| 1970 | 176 | 57 | 32 | 2 | 8 |
| 1971 | 178 | 61 | 49 | −5 | 9 |
| 1972 | 179 | 68 | 55 | −9 | 9 |
| 1973 | 175 | 72 | 74 | −10 | 9 |
| 1974 | 168 | 74 | 80 | 0 | 9 |
| 1975 | 175 | 81 | 101 | 1 | 10 |
| 1976 | 172 | 83 | 113 | −1 | 12 |
| 1977 | 175 | 89 | 70 | −2 | 10 |
| 1978 | 172 | 92 | 59 | 1 | 10 |
| 1979 | 174 | 90 | 44 | 3 | 10 |
| 1980 | 171 | 95 | 34 | 0 | 9 |
| 1981 | 170 | 92 | 29 | 3 | 8 |
| 1982 | 168 | 92 | 23 | 1 | 8 |
| 1983 | 165 | 96 | 19 | 0 | 8 |
| 1984 | 160 | 98 | 15 | 3 | 8 |
| 1985 | 157 | 101 | 11 | 2 | 8 |
| 1986 | 155 | 102 | 5 | 1 | 8 |
| 1987 | 150 | 103 | 4 | 3 | 7 |
| 1988 | 154 | 104 | 4 | 13 | 8 |
| 1989 | 151 | 104 | 4 | 8 | 7 |
| 1990 | 133 | 106 | 2 | 5 | 8 |
| 1991 | 141 | 107 | 3 | 1 | 8 |
| 1992 | 139 | 113 | 6 | 7 | 8 |
| 1993 | 137 | 114 | 6 | 10 | 7 |
| 1994 | 147 | 117 | 8 | 2 | 7 |
| 1995 | 137 | 118 | 8 | 2 | 7 |
| 1996 | 128 | 116 | 8 | 1 | 7 |
| 1997 | 139 | 116 | 8 | −2 | 7 |
| 1998 | 142 | 116 | 7 | 6 | 6 |
| 1999 | 144 | 118 | 8 | 4 | 6 |
| 2000 | 156 | 122 | 8 | 2 | 6 |
| 2001 | 137 | 127 | 7 | −5 | 7 |
| 2002 | 158 | 132 | 10 | −6 | 7 |
| 2003 | 166 | 138 | 12 | 3 | 7 |
| 2004 | 171 | 149 | 14 | −11 | 8 |
| 2005 | 191 | 154 | 15 | 5 | 10 |
| 2006 | 184 | 153 | 14 | −6 | 14 |
| 2007 | 176 | 160 | 13 | −4 | 15 |
| 2008 | 199 | 177 | 13 | −2 | 19 |
| 2009 | 217 | 197 | 16 | −3 | 22 |
| 2010 | 228 | 212 | 37 | 2 | 23 |
| 2011 | 265 | 225 | 48 | 6 | 29 |
| 2012 | 246 | 222 | 46 | 6 | 28 |
| 2013 | 282 | 225 | 55 | 6 | 27 |
| 2014 | 295 | 234 | 56 | 9 | 29 |
| 2015 | 313 | 253 | 55 | 3 | 30 |
| 2016 | 350 | 263 | 58 | 3 | 29 |
| 2017 | 339 | 274 | 52 | −2 | 31 |
| 2018 | 327 | 283 | 47 | −5 | 32 |
| 2019 | 378 | 300 | 49 | −12 | 32 |
| 2020 | 404 | 333 | 47 | −13 | 32 |
| 2021 | 411 | 354 | 43 | −12 | 35 |
| 2022 | 461 | 365 | 39 | 5 | 34 |
| 2023 | 472 | 392 | 39 | 1 | 37 |
| 2024 | 487 | 418 | 41 | −11 | 48 |
| 2025 | 587 | 435 | 48 | 3 | 30 |
| 2026 | 646 | 469 | 62 | 7 | 63 |
| 2027 | 702 | 503 | 68 | 2 | 43 |
| 2028 | 815 | 543 | 77 | 2 | 41 |
| 2029 | 743 | 542 | 70 | 2 | 38 |
| 2030 | 844 | 533 | 75 | 2 | 37 |
| 2031 | 884 | 525 | 75 | 2 | 37 |
Download SVG · CSV. Data and chart licensed CC BY 4.0.
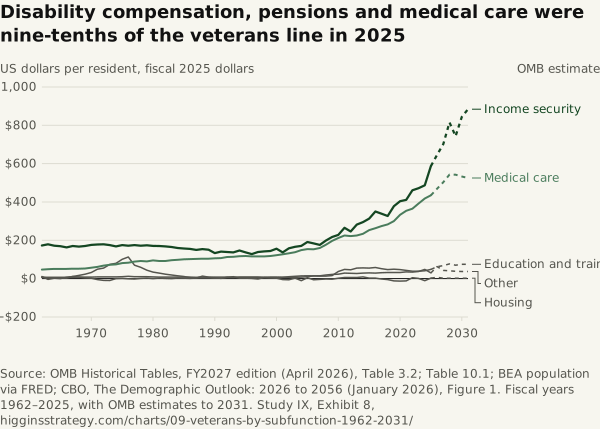
Higgins Strategy. “Disability compensation, pensions and medical care were nine-tenths of the veterans line in 2025” Exhibit 8, Every Dollar of War (Study IX). October 12, 2026. https://higginsstrategy.com/charts/09-veterans-by-subfunction-1962-2031/