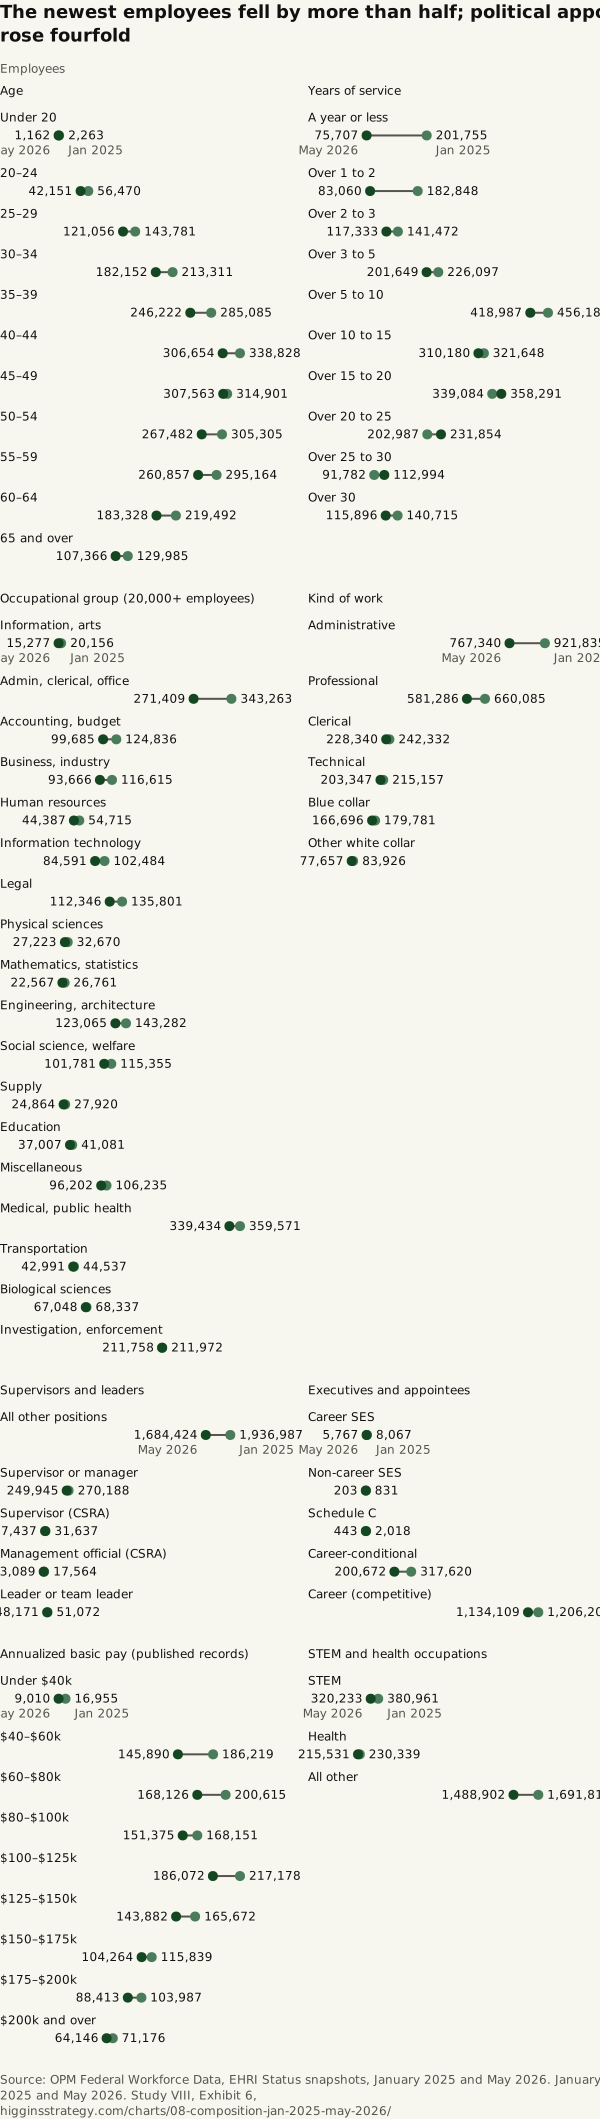
The newest employees fell by more than half; political appointees rose fourfold
Source. OPM Federal Workforce Data, EHRI Status snapshots, January 2025 and May 2026. January 2025 and May 2026.
Method and data
Method. Every employee in OPM’s file, January 2025 against May 2026, by age, length of service, occupational group (groups with 20,000 or more employees, sorted by change), OPM’s PATCO kind of work, supervisory status, appointment type, annualized basic pay and OPM’s STEM and health flags. Service bins are right-closed: “a year or less” counts service up to and including one year. Counts by age, tenure, occupation and status are complete; pay bands cover only the published records — pay is published for about 54% of records, the rest redacted for employees in sensitive positions, concentrated in Defense, Homeland Security and Justice. Each panel has its own scale.
| Measure | Group | Jan 2025 | May 2026 | % change |
|---|---|---|---|---|
| Age | Under 20 | 2,263 | 1,162 | −48.7 |
| Age | 20–24 | 56,470 | 42,151 | −25.4 |
| Age | 25–29 | 143,781 | 121,056 | −15.8 |
| Age | 30–34 | 213,311 | 182,152 | −14.6 |
| Age | 35–39 | 285,085 | 246,222 | −13.6 |
| Age | 40–44 | 338,828 | 306,654 | −9.5 |
| Age | 45–49 | 314,901 | 307,563 | −2.3 |
| Age | 50–54 | 305,305 | 267,482 | −12.4 |
| Age | 55–59 | 295,164 | 260,857 | −11.6 |
| Age | 60–64 | 219,492 | 183,328 | −16.5 |
| Age | 65 and over | 129,985 | 107,366 | −17.4 |
| Years of service | A year or less | 201,755 | 75,707 | −62.5 |
| Years of service | Over 1 to 2 | 182,848 | 83,060 | −54.6 |
| Years of service | Over 2 to 3 | 141,472 | 117,333 | −17.1 |
| Years of service | Over 3 to 5 | 226,097 | 201,649 | −10.8 |
| Years of service | Over 5 to 10 | 456,181 | 418,987 | −8.2 |
| Years of service | Over 10 to 15 | 321,648 | 310,180 | −3.6 |
| Years of service | Over 15 to 20 | 339,084 | 358,291 | 5.7 |
| Years of service | Over 20 to 25 | 202,987 | 231,854 | 14.2 |
| Years of service | Over 25 to 30 | 91,782 | 112,994 | 23.1 |
| Years of service | Over 30 | 140,715 | 115,896 | −17.6 |
| Occupational group (20,000+ employees) | Information, arts | 20,156 | 15,277 | −24.2 |
| Occupational group (20,000+ employees) | Admin, clerical, office | 343,263 | 271,409 | −20.9 |
| Occupational group (20,000+ employees) | Accounting, budget | 124,836 | 99,685 | −20.1 |
| Occupational group (20,000+ employees) | Business, industry | 116,615 | 93,666 | −19.7 |
| Occupational group (20,000+ employees) | Human resources | 54,715 | 44,387 | −18.9 |
| Occupational group (20,000+ employees) | Information technology | 102,484 | 84,591 | −17.5 |
| Occupational group (20,000+ employees) | Legal | 135,801 | 112,346 | −17.3 |
| Occupational group (20,000+ employees) | Physical sciences | 32,670 | 27,223 | −16.7 |
| Occupational group (20,000+ employees) | Mathematics, statistics | 26,761 | 22,567 | −15.7 |
| Occupational group (20,000+ employees) | Engineering, architecture | 143,282 | 123,065 | −14.1 |
| Occupational group (20,000+ employees) | Social science, welfare | 115,355 | 101,781 | −11.8 |
| Occupational group (20,000+ employees) | Supply | 27,920 | 24,864 | −10.9 |
| Occupational group (20,000+ employees) | Education | 41,081 | 37,007 | −9.9 |
| Occupational group (20,000+ employees) | Miscellaneous | 106,235 | 96,202 | −9.4 |
| Occupational group (20,000+ employees) | Medical, public health | 359,571 | 339,434 | −5.6 |
| Occupational group (20,000+ employees) | Transportation | 44,537 | 42,991 | −3.5 |
| Occupational group (20,000+ employees) | Biological sciences | 68,337 | 67,048 | −1.9 |
| Occupational group (20,000+ employees) | Investigation, enforcement | 211,972 | 211,758 | −0.1 |
| Kind of work | Administrative | 921,835 | 767,340 | −16.8 |
| Kind of work | Professional | 660,085 | 581,286 | −11.9 |
| Kind of work | Clerical | 242,332 | 228,340 | −5.8 |
| Kind of work | Technical | 215,157 | 203,347 | −5.5 |
| Kind of work | Blue collar | 179,781 | 166,696 | −7.3 |
| Kind of work | Other white collar | 83,926 | 77,657 | −7.5 |
| Supervisors and leaders | All other positions | 1,936,987 | 1,684,424 | −13 |
| Supervisors and leaders | Supervisor or manager | 270,188 | 249,945 | −7.5 |
| Supervisors and leaders | Supervisor (CSRA) | 31,637 | 27,437 | −13.3 |
| Supervisors and leaders | Management official (CSRA) | 17,564 | 13,089 | −25.5 |
| Supervisors and leaders | Leader or team leader | 48,171 | 51,072 | 6 |
| Executives and appointees | Career SES | 8,067 | 5,767 | −28.5 |
| Executives and appointees | Non-career SES | 203 | 831 | 309.4 |
| Executives and appointees | Schedule C | 443 | 2,018 | 355.5 |
| Executives and appointees | Career-conditional | 317,620 | 200,672 | −36.8 |
| Executives and appointees | Career (competitive) | 1,206,205 | 1,134,109 | −6 |
| Annualized basic pay (published records) | Under $40k | 16,955 | 9,010 | −46.9 |
| Annualized basic pay (published records) | $40–$60k | 186,219 | 145,890 | −21.7 |
| Annualized basic pay (published records) | $60–$80k | 200,615 | 168,126 | −16.2 |
| Annualized basic pay (published records) | $80–$100k | 168,151 | 151,375 | −10 |
| Annualized basic pay (published records) | $100–$125k | 217,178 | 186,072 | −14.3 |
| Annualized basic pay (published records) | $125–$150k | 165,672 | 143,882 | −13.2 |
| Annualized basic pay (published records) | $150–$175k | 115,839 | 104,264 | −10 |
| Annualized basic pay (published records) | $175–$200k | 103,987 | 88,413 | −15 |
| Annualized basic pay (published records) | $200k and over | 71,176 | 64,146 | −9.9 |
| STEM and health occupations | STEM | 380,961 | 320,233 | −15.9 |
| STEM and health occupations | Health | 230,339 | 215,531 | −6.4 |
| STEM and health occupations | All other | 1,691,816 | 1,488,902 | −12 |
Download SVG · CSV. Data and chart licensed CC BY 4.0.
Higgins Strategy. “The newest employees fell by more than half; political appointees rose fourfold” Exhibit 6, Every Federal Job (Study VIII). October 12, 2026. https://higginsstrategy.com/charts/08-composition-jan-2025-may-2026/