From Study V · Part Three, Exhibit 7
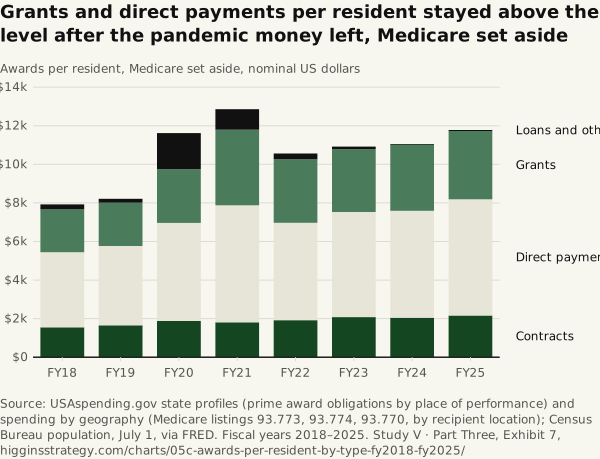
Grants and direct payments per resident stayed above their FY2019 level after the pandemic money left, Medicare set aside
Source. USAspending.gov state profiles (prime award obligations by place of performance) and spending by geography (Medicare listings 93.773, 93.774, 93.770, by recipient location); Census Bureau population, July 1, via FRED. Fiscal years 2018–2025.
Method and data
Method. Per-resident awards by type, FY2018–FY2025, 50 states and DC, nominal dollars, Medicare set aside. Loans are the amounts USAspending reports in its state profiles (the Paycheck Protection Program’s $532 billion in FY2020 and $280 billion in FY2021 under assistance listing 59.073), drawn with other financial assistance as one band. Medicare as recorded, set aside from the bars, is in the table.
| Fiscal year | Contracts | Direct payments, Medicare set aside | Grants | Loans (as reported) | Other assistance | All awards, Medicare set aside | Medicare as recorded |
|---|---|---|---|---|---|---|---|
| 2018 | 1,552 | 3,891 | 2,222 | 17 | 240 | 7,922 | 2,097 |
| 2019 | 1,653 | 4,113 | 2,244 | −19 | 221 | 8,213 | 2,299 |
| 2020 | 1,879 | 5,084 | 2,786 | 1,650 | 220 | 11,619 | 2,678 |
| 2021 | 1,809 | 6,066 | 3,923 | 825 | 238 | 12,862 | 2,448 |
| 2022 | 1,916 | 5,053 | 3,290 | 16 | 285 | 10,561 | 2,651 |
| 2023 | 2,077 | 5,454 | 3,257 | −17 | 148 | 10,920 | 2,925 |
| 2024 | 2,046 | 5,546 | 3,417 | −5 | 44 | 11,047 | 3,005 |
| 2025 | 2,164 | 6,021 | 3,542 | 1 | 53 | 11,781 | 3,377 |
Download SVG · CSV. Data and chart licensed CC BY 4.0.
Higgins Strategy. “Grants and direct payments per resident stayed above their FY2019 level after the pandemic money left, Medicare set aside” Exhibit 7, Federal Dollars by State, Over Time (Study V · Part Three). October 12, 2026. https://higginsstrategy.com/charts/05c-awards-per-resident-by-type-fy2018-fy2025/