From Study V · Part Three, Exhibit 3
Recorded Medicare doubled from $578 billion in FY2014 to $1,164 billion in FY2025, and its largest line moved from Pennsylvania to Minnesota
Source. USAspending.gov spending by geography (scope recipient location, geo layer state), Medicare listings 93.773, 93.774, 93.770, award types 06 and 10. Fiscal years 2014–2025.
Method and data
Method. Medicare as recorded by USAspending, FY2014–FY2025, by recipient state, in billions of dollars: the six largest FY2025 lines and all other areas (the other 44 states, DC and Puerto Rico). The spending-by-geography endpoint, scope recipient location, geo layer state, filtered to assistance listings 93.773, 93.774 and 93.770 and to award types 06 and 10 (direct payments). Every area’s series is in the CSV.
| Fiscal year | Minnesota | Indiana | Pennsylvania | Kentucky | North Dakota | Connecticut | All other areas | All 52 areas |
|---|---|---|---|---|---|---|---|---|
| 2014 | 25.0 | 68.1 | 91.9 | 36.6 | 52.2 | 31.0 | 273.2 | 578.0 |
| 2015 | 31.1 | 82.4 | 96.2 | 42.7 | 54.9 | 32.5 | 277.0 | 616.7 |
| 2016 | 43.1 | 85.0 | 99.2 | 52.0 | 56.6 | 37.9 | 299.9 | 673.7 |
| 2017 | 54.5 | 86.5 | 99.9 | 52.5 | 59.9 | 32.5 | 301.3 | 687.0 |
| 2018 | 62.4 | 90.3 | 101.8 | 48.9 | 62.7 | 29.1 | 295.1 | 690.3 |
| 2019 | 78.2 | 97.3 | 105.7 | 58.6 | 66.0 | 38.3 | 316.9 | 760.9 |
| 2020 | 91.8 | 119.1 | 124.5 | 68.7 | 80.1 | 43.9 | 366.6 | 894.6 |
| 2021 | 106.0 | 100.5 | 95.7 | 77.1 | 63.4 | 48.6 | 328.8 | 820.2 |
| 2022 | 137.4 | 100.0 | 90.2 | 94.8 | 61.0 | 58.6 | 352.3 | 894.2 |
| 2023 | 153.6 | 119.2 | 105.6 | 99.7 | 73.6 | 61.2 | 380.4 | 993.2 |
| 2024 | 156.7 | 124.9 | 110.9 | 100.6 | 81.5 | 66.8 | 388.0 | 1,029.4 |
| 2025 | 181.9 | 134.5 | 119.4 | 109.8 | 87.9 | 80.5 | 449.6 | 1,163.6 |
Download fb5-18d-medicare-as-recorded-by-recipient-state-fy2014-fy2025.csv
Download SVG · CSV. Data and chart licensed CC BY 4.0.
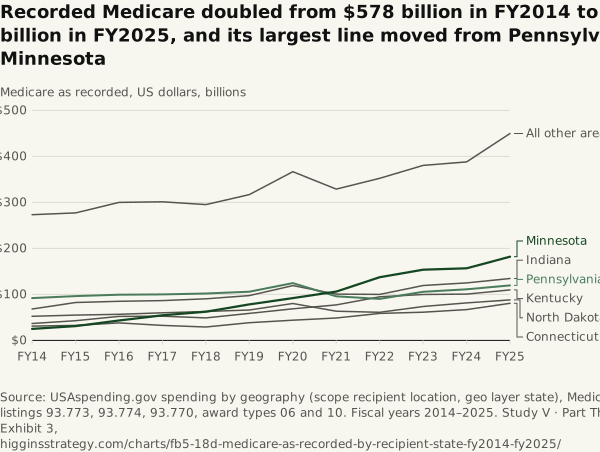
Higgins Strategy. “Recorded Medicare doubled from $578 billion in FY2014 to $1,164 billion in FY2025, and its largest line moved from Pennsylvania to Minnesota” Exhibit 3, Federal Dollars by State, Over Time (Study V · Part Three). October 12, 2026. https://higginsstrategy.com/charts/fb5-18d-medicare-as-recorded-by-recipient-state-fy2014-fy2025/