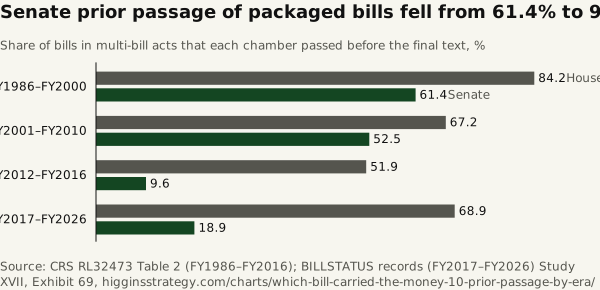
Senate prior passage of packaged bills fell from 61.4% to 9.6%
Source. CRS RL32473 Table 2 (FY1986–FY2016); BILLSTATUS records (FY2017–FY2026)
Method and data
Method. Shares cover only bills enacted in multi-bill acts, so FY2011 (one stand-alone bill, 11 under a full-year CR) and FY2025 (full-year CR) contribute no packaged bills and do not appear. FY2012–FY2016 is recomputed here and equals the CRS count.
| Era | Basis | Bills in acts | House prior passage | House (%) | Senate prior passage | Senate (%) |
|---|---|---|---|---|---|---|
| FY1986-FY2000 | CRS RL32473 Table 2 | 57 | 48 | 84.2 | 35 | 61.4 |
| FY2001-FY2010 | CRS RL32473 Table 2 | 61 | 41 | 67.2 | 32 | 52.5 |
| FY2012-FY2016 | CRS RL32473 Table 2 | 52 | 27 | 51.9 | 5 | 9.6 |
| FY2017-FY2026 | this study (Exhibit 65 data) | 106 | 73 | 68.9 | 20 | 18.9 |
| FY1986-FY2016 total | CRS RL32473 Table 2 | 170 | 116 | 68.2 | 72 | 42.4 |
Download which-bill-carried-the-money-10-prior-passage-by-era.csv