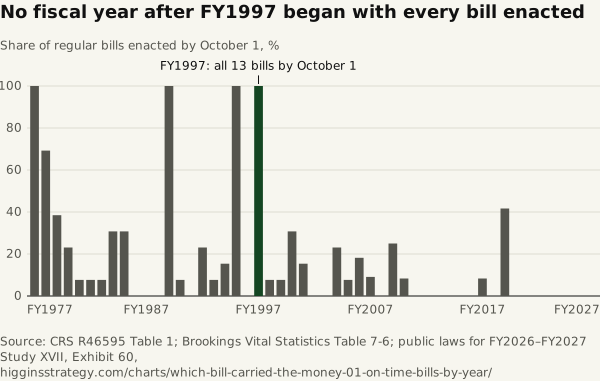
No fiscal year after FY1997 began with every bill enacted
Source. CRS R46595 Table 1; Brookings Vital Statistics Table 7-6; public laws for FY2026–FY2027
Method and data
Method. FY1977–FY2025 follow CRS R46595 Table 1. FY2026 and FY2027 are counted from the enacting acts. Where Brookings Table 7-6 differs on bills enacted by the start of the year (FY1982, FY1997, FY2009, FY2017), the comment column of the CSV records its figure. For FY1989, Brookings footnote c notes that Congress cleared all bills by the start of the year but the President signed the last one the following day; both sources show 13.
| Fiscal year | Regular bills | Enacted by Oct. 1 | Share enacted by Oct. 1 | Basis | Comment |
|---|---|---|---|---|---|
| 1977 | 13 | 13 | 1 | CRS R46595 Table 1 | Brookings fn. b: all 13 bills became law before FY1977, but the 2 CRs funded activities not in those acts |
| 1978 | 13 | 9 | 0.6923 | CRS R46595 Table 1 | |
| 1979 | 13 | 5 | 0.3846 | CRS R46595 Table 1 | |
| 1980 | 13 | 3 | 0.2308 | CRS R46595 Table 1 | |
| 1981 | 13 | 1 | 0.0769 | CRS R46595 Table 1 | |
| 1982 | 13 | 1 | 0.0769 | CRS R46595 Table 1 | Brookings Table 7-6 shows 0 bills by Oct. 1 |
| 1983 | 13 | 1 | 0.0769 | CRS R46595 Table 1 | |
| 1984 | 13 | 4 | 0.3077 | CRS R46595 Table 1 | |
| 1985 | 13 | 4 | 0.3077 | CRS R46595 Table 1 | |
| 1986 | 13 | 0 | 0 | CRS R46595 Table 1 | |
| 1987 | 13 | 0 | 0 | CRS R46595 Table 1 | |
| 1988 | 13 | 0 | 0 | CRS R46595 Table 1 | |
| 1989 | 13 | 13 | 1 | CRS R46595 Table 1 | Brookings fn. c: all bills reached the President by the start of FY1989; he signed the last one the following day |
| 1990 | 13 | 1 | 0.0769 | CRS R46595 Table 1 | |
| 1991 | 13 | 0 | 0 | CRS R46595 Table 1 | |
| 1992 | 13 | 3 | 0.2308 | CRS R46595 Table 1 | |
| 1993 | 13 | 1 | 0.0769 | CRS R46595 Table 1 | |
| 1994 | 13 | 2 | 0.1538 | CRS R46595 Table 1 | |
| 1995 | 13 | 13 | 1 | CRS R46595 Table 1 | |
| 1996 | 13 | 0 | 0 | CRS R46595 Table 1 | |
| 1997 | 13 | 13 | 1 | CRS R46595 Table 1 | Brookings Table 7-6 shows 8 bills by Oct. 1; Brookings fn. d: all bills enacted by the start of FY1997 but not as 13 separate acts |
| 1998 | 13 | 1 | 0.0769 | CRS R46595 Table 1 | |
| 1999 | 13 | 1 | 0.0769 | CRS R46595 Table 1 | |
| 2000 | 13 | 4 | 0.3077 | CRS R46595 Table 1 | |
| 2001 | 13 | 2 | 0.1538 | CRS R46595 Table 1 | |
| 2002 | 13 | 0 | 0 | CRS R46595 Table 1 | |
| 2003 | 13 | 0 | 0 | CRS R46595 Table 1 | |
| 2004 | 13 | 3 | 0.2308 | CRS R46595 Table 1 | |
| 2005 | 13 | 1 | 0.0769 | CRS R46595 Table 1 | |
| 2006 | 11 | 2 | 0.1818 | CRS R46595 Table 1 | |
| 2007 | 11 | 1 | 0.0909 | CRS R46595 Table 1 | |
| 2008 | 12 | 0 | 0 | CRS R46595 Table 1 | |
| 2009 | 12 | 3 | 0.25 | CRS R46595 Table 1 | Brookings Table 7-6 shows 0 bills by Oct. 1 |
| 2010 | 12 | 1 | 0.0833 | CRS R46595 Table 1 | |
| 2011 | 12 | 0 | 0 | CRS R46595 Table 1 | |
| 2012 | 12 | 0 | 0 | CRS R46595 Table 1 | |
| 2013 | 12 | 0 | 0 | CRS R46595 Table 1 | |
| 2014 | 12 | 0 | 0 | CRS R46595 Table 1 | |
| 2015 | 12 | 0 | 0 | CRS R46595 Table 1 | |
| 2016 | 12 | 0 | 0 | CRS R46595 Table 1 | |
| 2017 | 12 | 1 | 0.0833 | CRS R46595 Table 1 | Brookings Table 7-6 shows 0 bills by Oct. 1 |
| 2018 | 12 | 0 | 0 | CRS R46595 Table 1 | |
| 2019 | 12 | 5 | 0.4167 | CRS R46595 Table 1 | |
| 2020 | 12 | 0 | 0 | CRS R46595 Table 1 | |
| 2021 | 12 | 0 | 0 | CRS R46595 Table 1 | |
| 2022 | 12 | 0 | 0 | CRS R46595 Table 1 | |
| 2023 | 12 | 0 | 0 | CRS R46595 Table 1 | |
| 2024 | 12 | 0 | 0 | CRS R46595 Table 1 | |
| 2025 | 12 | 0 | 0 | CRS R46595 Table 1 | |
| 2026 | 12 | 0 | 0 | this study (enacting acts; see 06) | |
| 2027 | 12 | 0 | 0 | this study (P.L. 119-103 is a CR; no regular bill enacted) |
Download which-bill-carried-the-money-01-on-time-bills-by-year.csv