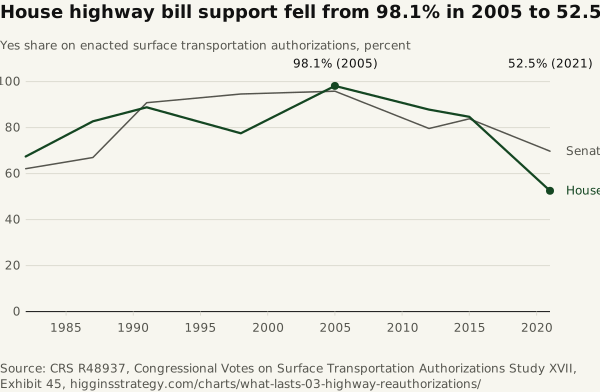
House highway bill support fell from 98.1% in 2005 to 52.5%
Source. CRS R48937, Congressional Votes on Surface Transportation Authorizations
Method and data
Method. The 1978 act passed by voice vote in both chambers and is not plotted. The 98.1% is the 2005 act. The 1982 and 1987 acts drew lower shares than the 2012 and 2015 acts, so the series does not fall steadily from 1982.
| Act | Year | House yeas | House nays | House yes share (%) | Senate yeas | Senate nays | Senate yes share (%) | Short-term extensions |
|---|---|---|---|---|---|---|---|---|
| Surface Transportation Assistance Act of 1978 | 1,978 | |||||||
| Surface Transportation Assistance Act of 1982 | 1,982 | 180 | 87 | 67.4 | 54 | 33 | 62.1 | |
| Surface Transportation and Uniform Relocation Assistance Act of 1987 | 1,987 | 350 | 73 | 82.7 | 67 | 33 | 67 | |
| Intermodal Surface Transportation Efficiency Act of 1991 | 1,991 | 372 | 47 | 88.8 | 79 | 8 | 90.8 | 1 |
| Transportation Equity Act for the 21st Century | 1,998 | 297 | 86 | 77.5 | 88 | 5 | 94.6 | 12 |
| SAFETEA-LU | 2,005 | 412 | 8 | 98.1 | 91 | 4 | 95.8 | 10 |
| Moving Ahead for Progress in the 21st Century Act | 2,012 | 373 | 52 | 87.8 | 74 | 19 | 79.6 | 5 |
| Fixing America's Surface Transportation Act | 2,015 | 359 | 65 | 84.7 | 83 | 16 | 83.8 | 3 |
| Infrastructure Investment and Jobs Act, Division A | 2,021 | 228 | 206 | 52.5 | 69 | 30 | 69.7 | 1 |