Agency by agency: what agencies, auditors and OPM’s data report
Source. TIGTA 2025-IE-R027; VA, July 8, 2025; GAO-26-108155 via Government Executive; GAO-26-108916 (OPM); USAID from the Partnership’s OPM tabulation. 2025–26.
Method and data
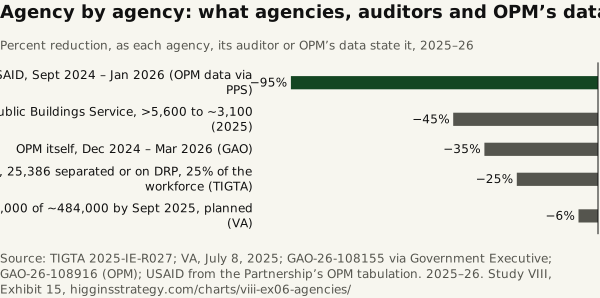
Method. Reductions stated by the agencies themselves or their auditors, and USAID’s from the Partnership’s tabulation of OPM data. The units differ — GSA’s is a headcount, the IRS figure is people separated or on a buyout as a share of the workforce (25,386, 25 percent, TIGTA), VA is a planned reduction reached by attrition after a canceled RIF — so the bars are each agency’s own claim, not one measure. Education’s and HHS’s stated reductions are not drawn: their releases and the press reports that give them could not be retrieved (What we could not verify).
| Agency, as stated | % change |
|---|---|
| USAID, Sept 2024 – Jan 2026 (OPM data via PPS) | −94.6 |
| GSA Public Buildings Service, >5,600 to ~3,100 (2025) | −44.6 |
| OPM itself, Dec 2024 – Mar 2026 (GAO) | −35 |
| IRS, 25,386 separated or on DRP, 25% of the workforce (TIGTA) | −25 |
| VA, ~29,000 of ~484,000 by Sept 2025, planned (VA) | −6 |
Download SVG · CSV. Data and chart licensed CC BY 4.0.
Higgins Strategy. “Agency by agency: what agencies, auditors and OPM’s data report” Exhibit 15, Every Federal Job in the Region (Study VIII). October 12, 2026. https://higginsstrategy.com/charts/viii-ex06-agencies/