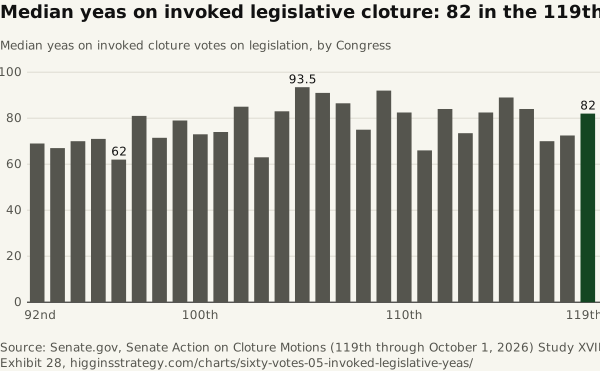
Median yeas on invoked legislative cloture: 82 in the 119th
Source. Senate.gov, Senate Action on Cloture Motions (119th through October 1, 2026)
Method and data
Method. For each Congress, the median of the yeas in every printed tally with result I (invoked) on rows classified legislative. Reconsidered motions that failed and then succeeded contribute only the successful tally.
| Congress | Years | Invoked legislative votes | Median yeas | Share with 70 or more yeas (%) |
|---|---|---|---|---|
| 92 | 1971-1972 | 4 | 69 | 50 |
| 93 | 1973-1974 | 9 | 67 | 22.2 |
| 94 | 1975-1976 | 17 | 70 | 58.8 |
| 95 | 1977-1978 | 3 | 71 | 66.7 |
| 96 | 1979-1980 | 7 | 62 | 28.6 |
| 97 | 1981-1982 | 9 | 81 | 66.7 |
| 98 | 1983-1984 | 10 | 71.5 | 60 |
| 99 | 1985-1986 | 8 | 79 | 62.5 |
| 100 | 1987-1988 | 9 | 73 | 66.7 |
| 101 | 1989-1990 | 11 | 74 | 63.6 |
| 102 | 1991-1992 | 21 | 85 | 81 |
| 103 | 1993-1994 | 10 | 63 | 30 |
| 104 | 1995-1996 | 9 | 83 | 55.6 |
| 105 | 1997-1998 | 16 | 93.5 | 93.8 |
| 106 | 1999-2000 | 26 | 91 | 92.3 |
| 107 | 2001-2002 | 30 | 86.5 | 76.7 |
| 108 | 2003-2004 | 12 | 75 | 75 |
| 109 | 2005-2006 | 25 | 92 | 88 |
| 110 | 2007-2008 | 60 | 82.5 | 73.3 |
| 111 | 2009-2010 | 52 | 66 | 36.5 |
| 112 | 2011-2012 | 36 | 84 | 91.7 |
| 113 | 2013-2014 | 44 | 73.5 | 63.6 |
| 114 | 2015-2016 | 58 | 82.5 | 69 |
| 115 | 2017-2018 | 29 | 89 | 82.8 |
| 116 | 2019-2020 | 27 | 84 | 88.9 |
| 117 | 2021-2022 | 28 | 70 | 50 |
| 118 | 2023-2024 | 18 | 72.5 | 55.6 |
| 119 | 2025-2026 | 27 | 82 | 70.4 |