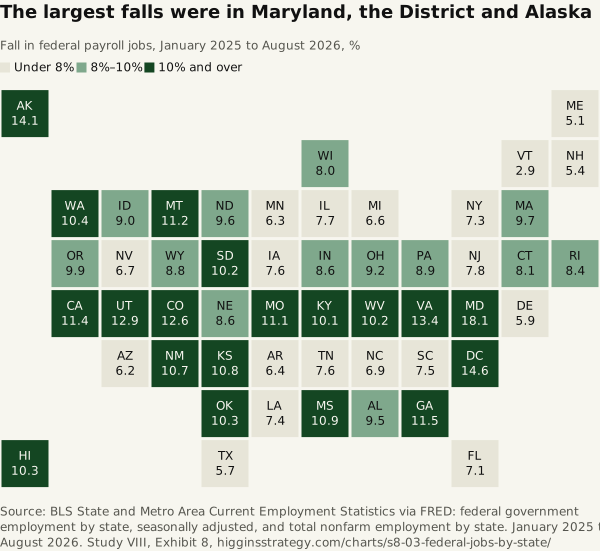
The largest falls were in Maryland, the District and Alaska
Source. BLS State and Metro Area Current Employment Statistics via FRED: federal government employment by state, seasonally adjusted, and total nonfarm employment by state. January 2025 to August 2026.
Method and data
Method. Federal government payroll jobs by state, seasonally adjusted, thousands, January 2025 against August 2026, where the job is rather than where the worker lives. Loss as % of all jobs divides the change by the state’s total nonfarm employment in January 2025; federal share is federal jobs over total nonfarm, January 2025. Tiles are shaded in three bins; a value on a break falls in the bin above it (Wisconsin’s 8.0 is in 8%–10%); the table, sorted by the percentage fall, gives every value. State estimates are made separately and need not sum to the national figure. All jobs are total nonfarm employment as the state series carry it, rounded to the thousand (the District’s is 765.5 thousand in BLS’s DCNA).
| State | Jan 2025 (thousands) | Aug 2026 (thousands) | Change (thousands) | % change | Loss, % of all jobs | Federal share of all jobs, % |
|---|---|---|---|---|---|---|
| Maryland | 162 | 132.7 | −29.3 | −18.1 | −1.03 | 5.7 |
| District of Columbia | 192.2 | 164.2 | −28 | −14.6 | −3.66 | 25.11 |
| Alaska | 15.6 | 13.4 | −2.2 | −14.1 | −0.65 | 4.62 |
| Virginia | 195.7 | 169.5 | −26.2 | −13.4 | −0.61 | 4.58 |
| Utah | 41.7 | 36.3 | −5.4 | −12.9 | −0.31 | 2.37 |
| Colorado | 57.1 | 49.9 | −7.2 | −12.6 | −0.24 | 1.92 |
| Georgia | 114.4 | 101.3 | −13.1 | −11.5 | −0.26 | 2.3 |
| California | 258 | 228.6 | −29.4 | −11.4 | −0.16 | 1.43 |
| Montana | 14.3 | 12.7 | −1.6 | −11.2 | −0.3 | 2.72 |
| Missouri | 57 | 50.7 | −6.3 | −11.1 | −0.21 | 1.92 |
| Mississippi | 27.5 | 24.5 | −3 | −10.9 | −0.25 | 2.31 |
| Kansas | 26.9 | 24 | −2.9 | −10.8 | −0.2 | 1.84 |
| New Mexico | 29.8 | 26.6 | −3.2 | −10.7 | −0.36 | 3.33 |
| Washington | 80.4 | 72 | −8.4 | −10.4 | −0.23 | 2.21 |
| Hawaii | 35.8 | 32.1 | −3.7 | −10.3 | −0.57 | 5.56 |
| Oklahoma | 53.4 | 47.9 | −5.5 | −10.3 | −0.31 | 2.98 |
| South Dakota | 11.8 | 10.6 | −1.2 | −10.2 | −0.26 | 2.51 |
| West Virginia | 26.5 | 23.8 | −2.7 | −10.2 | −0.38 | 3.71 |
| Kentucky | 36.5 | 32.8 | −3.7 | −10.1 | −0.18 | 1.8 |
| Oregon | 29.3 | 26.4 | −2.9 | −9.9 | −0.15 | 1.47 |
| Massachusetts | 46.3 | 41.8 | −4.5 | −9.7 | −0.12 | 1.24 |
| North Dakota | 9.4 | 8.5 | −0.9 | −9.6 | −0.2 | 2.1 |
| Alabama | 59.2 | 53.6 | −5.6 | −9.5 | −0.26 | 2.7 |
| Ohio | 85.2 | 77.4 | −7.8 | −9.2 | −0.14 | 1.51 |
| Idaho | 14.5 | 13.2 | −1.3 | −9 | −0.15 | 1.66 |
| Pennsylvania | 104 | 94.7 | −9.3 | −8.9 | −0.15 | 1.69 |
| Wyoming | 8 | 7.3 | −0.7 | −8.8 | −0.24 | 2.72 |
| Indiana | 40.6 | 37.1 | −3.5 | −8.6 | −0.11 | 1.24 |
| Nebraska | 17.4 | 15.9 | −1.5 | −8.6 | −0.14 | 1.64 |
| Rhode Island | 11.9 | 10.9 | −1 | −8.4 | −0.19 | 2.3 |
| Connecticut | 18.5 | 17 | −1.5 | −8.1 | −0.09 | 1.08 |
| Wisconsin | 31.3 | 28.8 | −2.5 | −8 | −0.08 | 1.03 |
| New Jersey | 50.2 | 46.3 | −3.9 | −7.8 | −0.09 | 1.15 |
| Illinois | 82.2 | 75.9 | −6.3 | −7.7 | −0.1 | 1.33 |
| Iowa | 18.4 | 17 | −1.4 | −7.6 | −0.09 | 1.15 |
| Tennessee | 58.2 | 53.8 | −4.4 | −7.6 | −0.13 | 1.73 |
| South Carolina | 38.6 | 35.7 | −2.9 | −7.5 | −0.12 | 1.63 |
| Louisiana | 32.4 | 30 | −2.4 | −7.4 | −0.12 | 1.62 |
| New York | 115.7 | 107.2 | −8.5 | −7.3 | −0.09 | 1.16 |
| Florida | 163.7 | 152 | −11.7 | −7.1 | −0.12 | 1.64 |
| North Carolina | 83.2 | 77.5 | −5.7 | −6.9 | −0.11 | 1.65 |
| Nevada | 22.5 | 21 | −1.5 | −6.7 | −0.1 | 1.43 |
| Michigan | 57.8 | 54 | −3.8 | −6.6 | −0.08 | 1.29 |
| Arkansas | 21.8 | 20.4 | −1.4 | −6.4 | −0.1 | 1.63 |
| Minnesota | 33.5 | 31.4 | −2.1 | −6.3 | −0.07 | 1.11 |
| Arizona | 59.7 | 56 | −3.7 | −6.2 | −0.11 | 1.82 |
| Delaware | 6.8 | 6.4 | −0.4 | −5.9 | −0.08 | 1.37 |
| Texas | 227.1 | 214.1 | −13 | −5.7 | −0.09 | 1.59 |
| New Hampshire | 9.2 | 8.7 | −0.5 | −5.4 | −0.07 | 1.31 |
| Maine | 17.8 | 16.9 | −0.9 | −5.1 | −0.14 | 2.69 |
| Vermont | 7 | 6.8 | −0.2 | −2.9 | −0.06 | 2.23 |
Download SVG · CSV. Data and chart licensed CC BY 4.0.
Higgins Strategy. “The largest falls were in Maryland, the District and Alaska” Exhibit 8, Every Federal Job (Study VIII). October 12, 2026. https://higginsstrategy.com/charts/s8-03-federal-jobs-by-state/