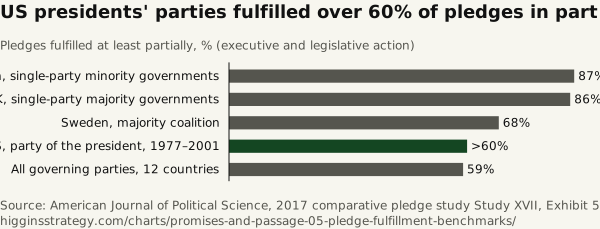
US presidents' parties fulfilled over 60% of pledges in part
Source. American Journal of Political Science, 2017 comparative pledge study
Method and data
Method. The US bar is drawn at 60 and labeled ">60%": the authors' summary says "over 60 percent" for US governments, 1977 to 2001. The other figures and counts are from the accepted manuscript, p. 21. Fulfillment there counts executive as well as legislative action, and the US and UK studies used a broader pledge definition.
| Government | Fulfilled at least partially (%) | Pledges fulfilled at least partially | Pledges | Basis | Where in the source |
|---|---|---|---|---|---|
| Sweden, single-party minority governments | 87 | 112 | 129 | exact | Thomson et al. 2017, accepted manuscript p.21 |
| UK, single-party majority governments | 86 | 494 | 575 | exact | Thomson et al. 2017, accepted manuscript p.21 |
| Sweden, majority coalition | 68 | 92 | 135 | exact | Thomson et al. 2017, accepted manuscript p.21 |
| US, party of the president, 1977-2001 | 60 | lower bound: 'over 60 percent' | authors' summary, AJPS blog, June 7, 2017 | ||
| All governing parties, 12 countries | 59 | 5,044 | 8,547 | exact | Thomson et al. 2017, accepted manuscript p.21 |
Download promises-and-passage-05-pledge-fulfillment-benchmarks.csv