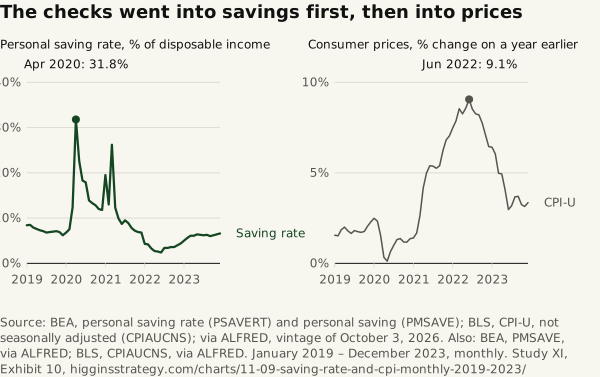
The checks went into savings first, then into prices
Source. BEA, personal saving rate (PSAVERT) and personal saving (PMSAVE); BLS, CPI-U, not seasonally adjusted (CPIAUCNS); via ALFRED, vintage of October 3, 2026. Also: BEA, PMSAVE, via ALFRED; BLS, CPIAUCNS, via ALFRED. January 2019 – December 2023, monthly.
Method and data
Method. The saving rate averaged 7.3% in 2019 (months 6.2–8.5%). Saving above the 2019 pace = the sum, over January 2020 – December 2021, of (personal saving, annual rate − the 2019 average, $1,178.2 billion) ÷ 12 = $2,493.6 billion. Consumer prices are the twelve-month change in CPI-U, not seasonally adjusted (the BLS headline): 1.40% in January 2021, 7.04% in December 2021, 9.06% in June 2022. Check months: April 2020 ($1,200), January 2021 ($600), March 2021 ($1,400).
| Month | Saving rate (%) | CPI-U, 12-month change (%) |
|---|---|---|
| 2019-01 | 8.4 | 1.55 |
| 2019-02 | 8.5 | 1.52 |
| 2019-03 | 7.9 | 1.86 |
| 2019-04 | 7.6 | 2.00 |
| 2019-05 | 7.3 | 1.79 |
| 2019-06 | 7.1 | 1.65 |
| 2019-07 | 6.8 | 1.81 |
| 2019-08 | 6.9 | 1.75 |
| 2019-09 | 7.0 | 1.71 |
| 2019-10 | 7.1 | 1.76 |
| 2019-11 | 6.9 | 2.05 |
| 2019-12 | 6.2 | 2.29 |
| 2020-01 | 6.8 | 2.49 |
| 2020-02 | 7.5 | 2.33 |
| 2020-03 | 12.4 | 1.54 |
| 2020-04 | 31.8 | 0.33 |
| 2020-05 | 22.6 | 0.12 |
| 2020-06 | 18.3 | 0.65 |
| 2020-07 | 17.9 | 0.99 |
| 2020-08 | 13.9 | 1.31 |
| 2020-09 | 13.3 | 1.37 |
| 2020-10 | 12.8 | 1.18 |
| 2020-11 | 12.0 | 1.17 |
| 2020-12 | 11.8 | 1.36 |
| 2021-01 | 19.5 | 1.40 |
| 2021-02 | 13.0 | 1.68 |
| 2021-03 | 26.2 | 2.62 |
| 2021-04 | 12.3 | 4.16 |
| 2021-05 | 9.9 | 4.99 |
| 2021-06 | 8.7 | 5.39 |
| 2021-07 | 9.5 | 5.37 |
| 2021-08 | 8.9 | 5.25 |
| 2021-09 | 7.8 | 5.39 |
| 2021-10 | 7.2 | 6.22 |
| 2021-11 | 6.9 | 6.81 |
| 2021-12 | 6.8 | 7.04 |
| 2022-01 | 4.3 | 7.48 |
| 2022-02 | 4.2 | 7.87 |
| 2022-03 | 3.3 | 8.54 |
| 2022-04 | 2.7 | 8.26 |
| 2022-05 | 2.6 | 8.58 |
| 2022-06 | 2.4 | 9.06 |
| 2022-07 | 3.4 | 8.52 |
| 2022-08 | 3.4 | 8.26 |
| 2022-09 | 3.6 | 8.20 |
| 2022-10 | 3.6 | 7.75 |
| 2022-11 | 4.0 | 7.11 |
| 2022-12 | 4.4 | 6.45 |
| 2023-01 | 5.0 | 6.41 |
| 2023-02 | 5.6 | 6.04 |
| 2023-03 | 6.1 | 4.98 |
| 2023-04 | 6.1 | 4.93 |
| 2023-05 | 6.4 | 4.05 |
| 2023-06 | 6.3 | 2.97 |
| 2023-07 | 6.2 | 3.18 |
| 2023-08 | 6.3 | 3.67 |
| 2023-09 | 6.0 | 3.70 |
| 2023-10 | 6.2 | 3.24 |
| 2023-11 | 6.4 | 3.14 |
| 2023-12 | 6.6 | 3.35 |
Download SVG · CSV. Data and chart licensed CC BY 4.0.
Higgins Strategy. “The checks went into savings first, then into prices” Exhibit 10, Five Thousand Dollars Each (Study XI). October 12, 2026. https://higginsstrategy.com/charts/11-09-saving-rate-and-cpi-monthly-2019-2023/