The Second World War towers over everything since
Source. OMB Historical Tables, FY2027 edition (April 2026), Table 3.1 and Table 10.1; BEA population via FRED; CBO, The Demographic Outlook: 2026 to 2056 (January 2026), Figure 1. Fiscal years 1940–2025, with OMB estimates to 2031.
Method and data
Method. Outlays by function from OMB’s Historical Tables, FY2027 edition, Table 3.1, in millions of current dollars as published: 050 National Defense, 150 International Affairs, 700 Veterans Benefits and Services. National defense is the Department of Defense’s military programs plus the Energy Department’s nuclear weapons activities and a small defense-related line; it excludes veterans (700), homeland security (spread across functions) and the Coast Guard. International affairs (150) is foreign economic and military assistance, the conduct of diplomacy, broadcasting and exchanges and international financial programs; its totals differ from ForeignAssistance.gov’s because the latter records obligations by all agencies, including Defense Department security assistance, and because outlays lag obligations. Every year is restated in fiscal 2025 dollars with OMB’s GDP (chained) price index (Table 10.1); OMB’s own constant-dollar outlay tables use its composite outlay deflators, so figures here will not match them. Per-resident figures divide by BEA’s calendar-year resident population (via FRED), which is a few months out of step with the fiscal year; 2026 uses the January–August 2026 average of Census monthly population (342,739 thousand). FY2027–2031 per resident: OMB’s estimates divided by the 2026 population (342,739 thousand, the January–August 2026 average of Census monthly population, as in Exhibit 1) grown at CBO’s projected rates for the Social Security area population (CBO, The Demographic Outlook: 2026 to 2056, January 2026, Figure 1: 0.253%, 0.259%, 0.275%, 0.29%, 0.3%); a calculation from published figures. Each rate is CBO’s growth over one calendar year, so the 2026 rate gives FY2027 and so on to the 2030 rate for FY2031, each year rounded to the thousand before the next is grown: 343,606, 344,496, 345,443, 346,445 and 347,484 thousand. Fiscal years ended June 30 through 1976 and September 30 from 1977; the July–September 1976 transition quarter is excluded. 2026–2031 are OMB’s estimates from the FY2027 Budget.
| Fiscal year | Basis | Defense, $ per resident | Veterans, $ per resident | Intl., $ per resident | Population, thousands |
|---|---|---|---|---|---|
| 1940 | Actual | 225 | 77.2 | 6.9 | 132,122 |
| 1941 | Actual | 832.4 | 72.4 | 18.8 | 133,402 |
| 1942 | Actual | 3,057.4 | 59.7 | 115.3 | 134,860 |
| 1943 | Actual | 7,360.3 | 30.5 | 141.9 | 136,739 |
| 1944 | Actual | 8,325.9 | −13.3 | 152.4 | 138,397 |
| 1945 | Actual | 8,431.9 | 11.2 | 194.4 | 139,928 |
| 1946 | Actual | 3,988.5 | 230.4 | 180.8 | 141,389 |
| 1947 | Actual | 1,058.8 | 524.5 | 478.7 | 144,126 |
| 1948 | Actual | 675.9 | 479.4 | 339 | 146,631 |
| 1949 | Actual | 928.1 | 465.7 | 427.1 | 149,188 |
| 1950 | Actual | 966.1 | 621.9 | 329 | 151,684 |
| 1951 | Actual | 1,547.4 | 362.8 | 239.5 | 154,287 |
| 1952 | Actual | 2,859.9 | 331.4 | 167 | 156,954 |
| 1953 | Actual | 3,165.3 | 270.9 | 127 | 159,565 |
| 1954 | Actual | 2,867.8 | 268.5 | 92.9 | 162,391 |
| 1955 | Actual | 2,426.1 | 265.4 | 126.2 | 165,275 |
| 1956 | Actual | 2,313 | 266 | 131.3 | 168,221 |
| 1957 | Actual | 2,338.8 | 257.7 | 162 | 171,274 |
| 1958 | Actual | 2,301 | 263 | 165.3 | 174,141 |
| 1959 | Actual | 2,332.8 | 259 | 149.6 | 177,130 |
| 1960 | Actual | 2,214.2 | 250.3 | 137.5 | 180,760 |
| 1961 | Actual | 2,214.7 | 254.7 | 142.2 | 183,742 |
| 1962 | Actual | 2,278.3 | 245 | 245.4 | 186,590 |
| 1963 | Actual | 2,263.8 | 234.1 | 225 | 189,300 |
| 1964 | Actual | 2,262.7 | 234.8 | 204.3 | 191,927 |
| 1965 | Actual | 2,030.6 | 229.6 | 211.5 | 194,347 |
| 1966 | Actual | 2,255.2 | 229.9 | 216.6 | 196,599 |
| 1967 | Actual | 2,661 | 251.2 | 207.4 | 198,752 |
| 1968 | Actual | 2,919.7 | 251 | 188.9 | 200,745 |
| 1969 | Actual | 2,784.1 | 257.9 | 155.2 | 202,736 |
| 1970 | Actual | 2,587.6 | 274.9 | 137.2 | 205,089 |
| 1971 | Actual | 2,347.2 | 291 | 123.8 | 207,692 |
| 1972 | Actual | 2,225.2 | 301.6 | 134.4 | 209,924 |
| 1973 | Actual | 2,046.4 | 320.6 | 110.7 | 211,939 |
| 1974 | Actual | 1,958.5 | 330.5 | 140.9 | 213,898 |
| 1975 | Actual | 1,916.4 | 367.7 | 157.2 | 215,981 |
| 1976 | Actual | 1,838.2 | 378.1 | 131.9 | 218,086 |
| 1977 | Actual | 1,841.3 | 341.6 | 120.3 | 220,289 |
| 1978 | Actual | 1,834.7 | 333.2 | 131.4 | 222,629 |
| 1979 | Actual | 1,869 | 320.2 | 119.8 | 225,106 |
| 1980 | Actual | 1,957.2 | 309.4 | 185.7 | 227,726 |
| 1981 | Actual | 2,074.5 | 302.8 | 172.6 | 230,008 |
| 1982 | Actual | 2,260.2 | 292.2 | 150 | 232,218 |
| 1983 | Actual | 2,431 | 287.8 | 137.2 | 234,333 |
| 1984 | Actual | 2,520.4 | 283.7 | 175.9 | 236,394 |
| 1985 | Actual | 2,686.5 | 279.4 | 171.9 | 238,506 |
| 1986 | Actual | 2,816.2 | 271.4 | 145.7 | 240,683 |
| 1987 | Actual | 2,816.2 | 267.3 | 116.3 | 242,843 |
| 1988 | Actual | 2,783.2 | 281.9 | 100.3 | 245,061 |
| 1989 | Actual | 2,770.4 | 274.1 | 87.5 | 247,387 |
| 1990 | Actual | 2,606.1 | 253.3 | 119.8 | 250,181 |
| 1991 | Actual | 2,266.9 | 259.8 | 131.4 | 253,530 |
| 1992 | Actual | 2,382.5 | 272.4 | 128.5 | 256,922 |
| 1993 | Actual | 2,241.9 | 274.9 | 132.6 | 260,282 |
| 1994 | Actual | 2,097.3 | 280.1 | 127.1 | 263,455 |
| 1995 | Actual | 1,960.6 | 273.2 | 118.4 | 266,588 |
| 1996 | Actual | 1,857.9 | 258.7 | 94.3 | 269,714 |
| 1997 | Actual | 1,836 | 267 | 103 | 272,958 |
| 1998 | Actual | 1,777 | 276.9 | 86.5 | 276,154 |
| 1999 | Actual | 1,777.9 | 279.6 | 98.6 | 279,328 |
| 2000 | Actual | 1,845.6 | 294.9 | 107.9 | 282,398 |
| 2001 | Actual | 1,846.9 | 272.9 | 99.9 | 285,225 |
| 2002 | Actual | 2,059.5 | 301.3 | 131.9 | 287,955 |
| 2003 | Actual | 2,325.4 | 326.5 | 121.8 | 290,626 |
| 2004 | Actual | 2,533.5 | 332 | 149.4 | 293,262 |
| 2005 | Actual | 2,647 | 374.7 | 184.7 | 295,993 |
| 2006 | Actual | 2,675.5 | 358 | 151.2 | 298,818 |
| 2007 | Actual | 2,724.5 | 359.9 | 140.8 | 301,696 |
| 2008 | Actual | 2,955 | 406.3 | 138.4 | 304,543 |
| 2009 | Actual | 3,110.9 | 449.7 | 176.6 | 307,240 |
| 2010 | Actual | 3,208.6 | 501.9 | 209.1 | 309,839 |
| 2011 | Actual | 3,175 | 572.7 | 205.6 | 312,295 |
| 2012 | Actual | 2,972.9 | 546.8 | 161.4 | 314,725 |
| 2013 | Actual | 2,708.2 | 594.4 | 198.6 | 317,099 |
| 2014 | Actual | 2,513.9 | 623.3 | 195.3 | 319,601 |
| 2015 | Actual | 2,412.3 | 653.7 | 212.9 | 322,113 |
| 2016 | Actual | 2,389.7 | 703 | 182.5 | 324,609 |
| 2017 | Actual | 2,354.9 | 694.5 | 182.1 | 326,860 |
| 2018 | Actual | 2,414.6 | 684.3 | 187 | 328,794 |
| 2019 | Actual | 2,562.4 | 746.8 | 198.2 | 330,513 |
| 2020 | Actual | 2,661.8 | 803.2 | 113.6 | 331,840 |
| 2021 | Actual | 2,673 | 830.7 | 160.2 | 332,503 |
| 2022 | Actual | 2,521.4 | 903.7 | 232.3 | 334,350 |
| 2023 | Actual | 2,560.9 | 941.6 | 196.9 | 337,087 |
| 2024 | Actual | 2,636.1 | 982.7 | 170.2 | 340,095 |
| 2025 | Actual | 2,679.2 | 1,103 | 132.1 | 341,944 |
| 2026 | OMB estimate | 2,739.3 | 1,247.6 | 169.1 | 342,739 |
| 2027 | OMB estimate | 3,338.7 | 1,317.3 | 173.3 | 343,606 |
| 2028 | OMB estimate | 3,584.8 | 1,477.6 | 155 | 344,496 |
| 2029 | OMB estimate | 3,553.5 | 1,395.2 | 152.2 | 345,443 |
| 2030 | OMB estimate | 3,492.6 | 1,490.2 | 136 | 346,445 |
| 2031 | OMB estimate | 3,465.7 | 1,523.3 | 128.7 | 347,484 |
Download SVG · CSV. Data and chart licensed CC BY 4.0.
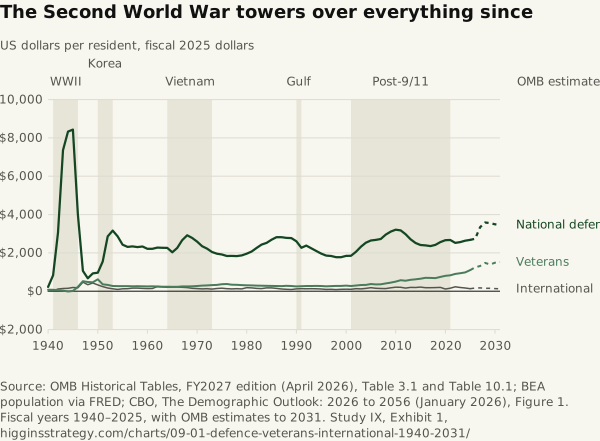
Higgins Strategy. “The Second World War towers over everything since” Exhibit 1, Every Dollar of War (Study IX). October 12, 2026. https://higginsstrategy.com/charts/09-01-defence-veterans-international-1940-2031/