The trains filled while the payroll emptied
Source. WMATA, FY2025 results; WMATA, FY2026 year-end results, September 10, 2026; BLS as Exhibit 12. FY2025 and FY2026; payroll January 2025 to August 2026.
Method and data
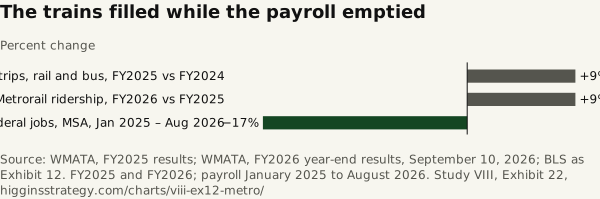
Method. Metro trips, rail and bus, rose 9 percent in FY2025 (264 million); Metrorail ridership rose 9 percent in FY2026, while total trips rose from 264 million to 268 million (1.5 percent). The region’s federal payroll fell 17 percent.
| Measure | % change |
|---|---|
| Metro trips, rail and bus, FY2025 vs FY2024 | 9 |
| Metrorail ridership, FY2026 vs FY2025 | 9 |
| Federal jobs, MSA, Jan 2025 – Aug 2026 | −17 |
Download SVG · CSV. Data and chart licensed CC BY 4.0.
Higgins Strategy. “The trains filled while the payroll emptied” Exhibit 22, Every Federal Job in the Region (Study VIII). October 12, 2026. https://higginsstrategy.com/charts/viii-ex12-metro/