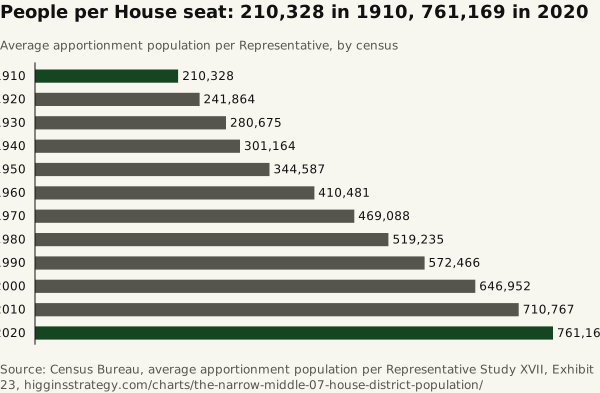
People per House seat: 210,328 in 1910, 761,169 in 2020
Source. Census Bureau, average apportionment population per Representative
Method and data
Method. The Census Bureau’s average apportionment population per Representative, as published in its apportionment file; the 1910 row covers 433 seats. Resident population divided by Representatives does not reproduce it (for 2020, 761,952 against the published 761,169), so the exhibit uses the published average and its data hold both.
| Census year | Representatives | Average apportionment population per Representative | Resident population | Resident population per Representative |
|---|---|---|---|---|
| 1910 | 433 | 210,328 | 92,228,531 | 212,999 |
| 1920 | 435 | 241,864 | 106,021,568 | 243,728 |
| 1930 | 435 | 280,675 | 123,202,660 | 283,225 |
| 1940 | 435 | 301,164 | 132,165,129 | 303,828 |
| 1950 | 435 | 344,587 | 151,325,798 | 347,875 |
| 1960 | 435 | 410,481 | 179,323,175 | 412,237 |
| 1970 | 435 | 469,088 | 203,211,926 | 467,154 |
| 1980 | 435 | 519,235 | 226,545,805 | 520,795 |
| 1990 | 435 | 572,466 | 248,709,873 | 571,747 |
| 2000 | 435 | 646,952 | 281,421,906 | 646,947 |
| 2010 | 435 | 710,767 | 308,745,538 | 709,760 |
| 2020 | 435 | 761,169 | 331,449,281 | 761,952 |