From Study V · Part Three, Exhibit 1
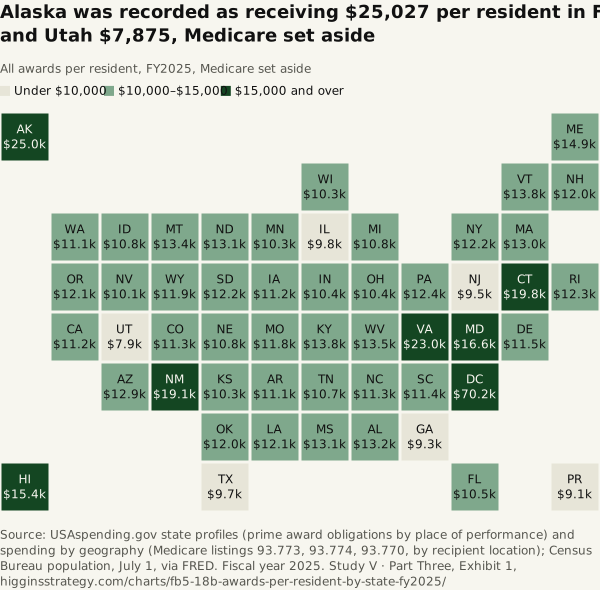
Alaska was recorded as receiving $25,027 per resident in FY2025 and Utah $7,875, Medicare set aside
Source. USAspending.gov state profiles (prime award obligations by place of performance) and spending by geography (Medicare listings 93.773, 93.774, 93.770, by recipient location); Census Bureau population, July 1, via FRED. Fiscal year 2025.
Method and data
Method. USAspending.gov’s state profile endpoint (/api/v2/recipient/state/{fips}/?year=FY) returns, for each state and fiscal year, the total prime award obligations whose place of performance is in the state (USAspending’s own code filters on the place-of-performance state), broken into contracts, direct payments, grants, loans and other financial assistance. “Medicare set aside” removes the three Medicare assistance listings, which are recorded in the states of the entities CMS pays rather than beneficiaries’ (Exhibits 2 and 3): the spending-by-geography endpoint, scope recipient location, gives the Medicare obligations recorded to each state, and that is subtracted from direct payments and from the total. Nothing is added back. For the three Medicare listings, place-of-performance and recipient-location sums are identical state by state, so the subtraction is unaffected by the two scopes. Per-resident figures divide the fiscal-year obligation total by the Census Bureau’s July 1 resident population for the same calendar year (Vintage 2025 for 2020 onward, via FRED). Puerto Rico appears in the totals and in the FY2025 per-resident figures (population 3,184,835, Census V2025) but not in the time series, because no population series for it was assembled. Obligations are the amounts committed in the year; for Social Security, Medicare, veterans’ benefits and SNAP, agencies report them as aggregate records by recipient state, so obligations and payments are close. The tiles shade in three bins (under $10,000; $10,000–$15,000; $15,000 and over); every value is in the table, sorted from the highest per resident. The proportionality index (in the CSV) is a state’s share of the 50-states-and-DC total, Medicare set aside, divided by its share of population; 1.00 means the state receives exactly its population share.
| State | All awards, Medicare set aside | All awards, as recorded | Contracts | Direct payments, Medicare set aside | Grants | Medicare as recorded |
|---|---|---|---|---|---|---|
| District of Columbia | 70,232 | 70,525 | 45,307 | 4,948 | 19,932 | 293 |
| Alaska | 25,027 | 25,027 | 5,225 | 8,252 | 11,296 | 0 |
| Virginia | 23,047 | 24,118 | 13,578 | 6,253 | 3,180 | 1,071 |
| Connecticut | 19,832 | 41,649 | 9,527 | 6,253 | 4,081 | 21,817 |
| New Mexico | 19,137 | 19,510 | 6,346 | 6,766 | 5,953 | 374 |
| Maryland | 16,588 | 16,865 | 6,334 | 5,803 | 4,434 | 277 |
| Hawaii | 15,389 | 15,809 | 3,849 | 6,678 | 4,830 | 421 |
| Maine | 14,939 | 15,567 | 2,776 | 7,682 | 4,441 | 628 |
| Kentucky | 13,805 | 37,639 | 2,263 | 6,373 | 5,081 | 23,834 |
| Vermont | 13,761 | 13,761 | 1,360 | 7,151 | 5,141 | 0 |
| West Virginia | 13,499 | 13,499 | 1,063 | 7,706 | 4,692 | 0 |
| Montana | 13,422 | 13,422 | 1,001 | 7,142 | 5,047 | 0 |
| Alabama | 13,236 | 13,783 | 3,494 | 6,900 | 2,825 | 547 |
| North Dakota | 13,149 | 123,129 | 1,027 | 6,873 | 4,905 | 109,979 |
| Mississippi | 13,055 | 13,055 | 2,709 | 6,729 | 3,566 | 0 |
| Massachusetts | 12,998 | 14,437 | 2,702 | 6,096 | 4,185 | 1,439 |
| Arizona | 12,860 | 14,713 | 3,062 | 6,401 | 3,374 | 1,853 |
| Pennsylvania | 12,417 | 21,560 | 2,063 | 6,667 | 3,691 | 9,144 |
| Rhode Island | 12,301 | 13,586 | 813 | 6,551 | 4,911 | 1,285 |
| South Dakota | 12,162 | 12,299 | 860 | 7,578 | 3,571 | 137 |
| New York | 12,150 | 13,109 | 604 | 5,949 | 5,588 | 959 |
| Louisiana | 12,141 | 12,954 | 1,030 | 6,123 | 4,936 | 813 |
| Oregon | 12,104 | 13,392 | 487 | 6,711 | 4,751 | 1,287 |
| New Hampshire | 12,027 | 12,027 | 2,059 | 7,358 | 2,577 | 0 |
| Oklahoma | 11,982 | 12,190 | 1,649 | 6,861 | 3,445 | 208 |
| Wyoming | 11,876 | 11,876 | 844 | 7,504 | 3,458 | 0 |
| Missouri | 11,836 | 14,952 | 2,228 | 6,335 | 3,234 | 3,116 |
| Delaware | 11,500 | 11,547 | 347 | 7,221 | 3,914 | 47 |
| South Carolina | 11,406 | 24,620 | 1,495 | 7,111 | 2,754 | 13,214 |
| North Carolina | 11,312 | 11,563 | 834 | 6,432 | 3,961 | 251 |
| Colorado | 11,264 | 11,606 | 2,679 | 5,458 | 3,089 | 342 |
| Iowa | 11,242 | 11,278 | 1,116 | 6,444 | 3,640 | 36 |
| California | 11,189 | 12,343 | 1,576 | 5,232 | 4,366 | 1,154 |
| Arkansas | 11,072 | 11,221 | 405 | 6,589 | 4,011 | 149 |
| Washington | 11,065 | 11,192 | 1,977 | 5,989 | 3,079 | 127 |
| Nebraska | 10,810 | 13,754 | 627 | 6,572 | 3,535 | 2,944 |
| Idaho | 10,763 | 11,271 | 1,946 | 5,875 | 2,890 | 508 |
| Michigan | 10,756 | 12,477 | 652 | 6,772 | 3,387 | 1,721 |
| Tennessee | 10,666 | 16,594 | 1,497 | 6,325 | 2,791 | 5,928 |
| Florida | 10,544 | 13,853 | 1,383 | 6,695 | 2,117 | 3,309 |
| Ohio | 10,432 | 10,846 | 826 | 6,019 | 3,569 | 414 |
| Indiana | 10,411 | 29,696 | 1,004 | 5,977 | 3,405 | 19,285 |
| Kansas | 10,341 | 10,425 | 1,203 | 6,524 | 2,573 | 85 |
| Wisconsin | 10,330 | 18,912 | 1,049 | 6,535 | 2,731 | 8,581 |
| Minnesota | 10,328 | 41,530 | 427 | 6,076 | 3,674 | 31,202 |
| Nevada | 10,074 | 10,352 | 1,228 | 5,785 | 3,032 | 278 |
| Illinois | 9,850 | 10,584 | 977 | 5,694 | 3,165 | 734 |
| Texas | 9,712 | 9,825 | 2,724 | 4,839 | 2,115 | 113 |
| New Jersey | 9,548 | 10,112 | 977 | 5,556 | 3,015 | 564 |
| Georgia | 9,290 | 9,368 | 1,031 | 5,737 | 2,467 | 78 |
| Puerto Rico | 9,086 | 12,068 | 289 | 5,825 | 2,967 | 2,981 |
| Utah | 7,875 | 8,226 | 1,476 | 4,154 | 2,238 | 351 |
| 50 states and DC | 11,781 | 15,158 | 2,164 | 6,021 | 3,542 | 3,377 |
Download SVG · CSV. Data and chart licensed CC BY 4.0.
Higgins Strategy. “Alaska was recorded as receiving $25,027 per resident in FY2025 and Utah $7,875, Medicare set aside” Exhibit 1, Federal Dollars by State, Over Time (Study V · Part Three). October 12, 2026. https://higginsstrategy.com/charts/fb5-18b-awards-per-resident-by-state-fy2025/