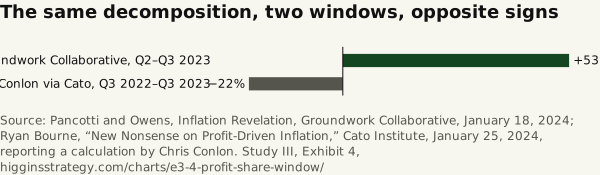
The same decomposition, two windows, opposite signs
Source. Pancotti and Owens, Inflation Revelation, Groundwork Collaborative, January 18, 2024; Ryan Bourne, “New Nonsense on Profit-Driven Inflation,” Cato Institute, January 25, 2024, reporting a calculation by Chris Conlon.
Method and data
Method. Share of price growth attributed to corporate profits in a unit-cost decomposition, percent. Extending the window back three quarters flips the sign from +53 to −22, with labor costs then accounting for more than all of the price increase. Bourne’s further objection is that over the original two-quarter window prices barely moved, so the calculation measures the extent to which a very small price change is accounted for by a very small profit change. A third objection is categorical: a unit-cost decomposition is an accounting identity and cannot establish that profits drove anything.
| Source | Window | Share of price growth, % |
|---|---|---|
| Groundwork Collaborative | Q2-Q3 2023 | 53 |
| Chris Conlon, cited by Cato | Q3 2022-Q3 2023 | −22 |
Download SVG · CSV. Data and chart licensed CC BY 4.0.
Higgins Strategy. “The same decomposition, two windows, opposite signs” Exhibit 4, The Same Question, Different Numbers (Study III). October 12, 2026. https://higginsstrategy.com/charts/e3-4-profit-share-window/