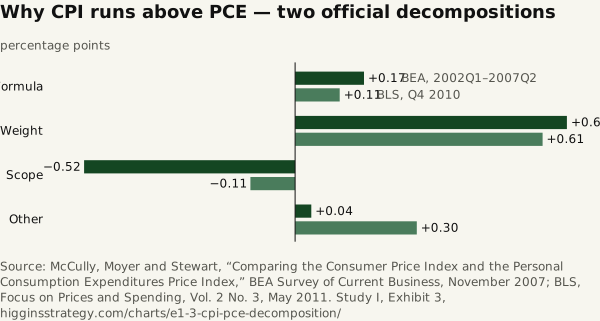
Why CPI runs above PCE — two official decompositions
Source. McCully, Moyer and Stewart, “Comparing the Consumer Price Index and the Personal Consumption Expenditures Price Index,” BEA Survey of Current Business, November 2007; BLS, Focus on Prices and Spending, Vol. 2 No. 3, May 2011.
Method and data
Method. Contributions to the CPI-over-PCE gap in percentage points. The two studies cover different periods and are not directly comparable; they are shown together because they are the two official decompositions on the record. Note a live disagreement: BEA’s own text says the formula effect “explains almost half” of the gap, while the arithmetic in both tables makes the weight effect larger. We present both as published rather than resolving it.
| Effect | BEA, 2002Q1–2007Q2, pp | BLS, Q4 2010, pp |
|---|---|---|
| Formula | 0.17 | 0.11 |
| Weight | 0.67 | 0.61 |
| Scope | −0.52 | −0.11 |
| Other | 0.04 | 0.3 |
Download SVG · CSV. Data and chart licensed CC BY 4.0.
Higgins Strategy. “Why CPI runs above PCE — two official decompositions” Exhibit 3, Which Inflation? (Study I). October 12, 2026. https://higginsstrategy.com/charts/e1-3-cpi-pce-decomposition/