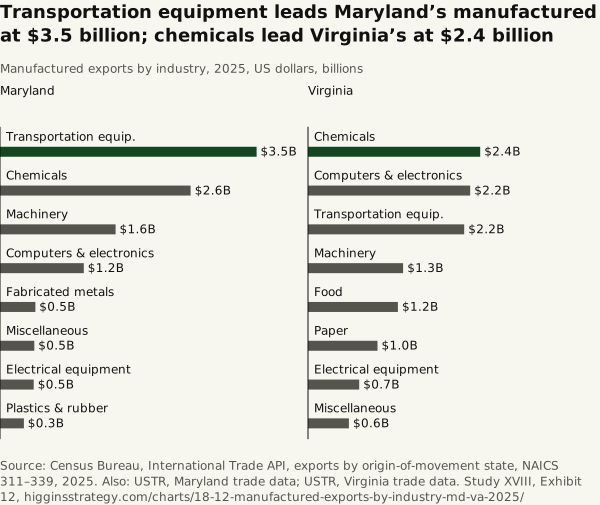
Transportation equipment leads Maryland’s manufactured exports at $3.5 billion; chemicals lead Virginia’s at $2.4 billion
Source. Census Bureau, International Trade API, exports by origin-of-movement state, NAICS 311–339, 2025. Also: USTR, Maryland trade data; USTR, Virginia trade data.
Method and data
Method. NAICS 311–339, three-digit.
| Rank | Industry (NAICS 3-digit) | Exports, 2025 ($ billion) |
|---|---|---|
| Maryland | ||
| 1 | Transportation equip. | 3.55 |
| 2 | Chemicals | 2.64 |
| 3 | Machinery | 1.60 |
| 4 | Computers & electronics | 1.16 |
| 5 | Fabricated metals | 0.49 |
| 6 | Miscellaneous | 0.47 |
| 7 | Electrical equipment | 0.47 |
| 8 | Plastics & rubber | 0.33 |
| 9 | Food | 0.31 |
| 10 | Primary metals | 0.26 |
| 11 | Printing | 0.23 |
| 12 | Paper | 0.21 |
| 13 | Textiles | 0.12 |
| 14 | Furniture | 0.06 |
| 15 | Nonmetallic minerals | 0.04 |
| Virginia | ||
| 1 | Chemicals | 2.38 |
| 2 | Computers & electronics | 2.24 |
| 3 | Transportation equip. | 2.16 |
| 4 | Machinery | 1.32 |
| 5 | Food | 1.24 |
| 6 | Paper | 0.96 |
| 7 | Electrical equipment | 0.71 |
| 8 | Miscellaneous | 0.57 |
| 9 | Plastics & rubber | 0.56 |
| 10 | Wood products | 0.38 |
| 11 | Textiles | 0.36 |
| 12 | Beverages & tobacco | 0.33 |
| 13 | Primary metals | 0.20 |
| 14 | Nonmetallic minerals | 0.17 |
| 15 | Petroleum & coal | 0.10 |
Download 18-12-manufactured-exports-by-industry-md-va-2025.csv
Download SVG · CSV. Data and chart licensed CC BY 4.0.
Higgins Strategy. “Transportation equipment leads Maryland’s manufactured exports at $3.5 billion; chemicals lead Virginia’s at $2.4 billion” Exhibit 12, What the Region Makes (Study XVIII). October 12, 2026. https://higginsstrategy.com/charts/18-12-manufactured-exports-by-industry-md-va-2025/