When the rate on the debt rises above growth, the debt feeds on itself
Source. Treasury Fiscal Data, Average Interest Rates on U.S. Treasury Securities, total interest-bearing debt, monthly; OMB, Historical Tables, FY2027 Budget (April 2026), Table 1.2 (GDP, fiscal years). Also: OMB, Table 1.2. Fiscal years 2002–2025.
Method and data
Method. r is the mean of the twelve monthly average rates on total interest-bearing debt, October to September; g is the growth of nominal GDP over the fiscal year (OMB Table 1.2). 2022: r 1.72% − g 10.94% = −9.23 points; 2025: 3.31% − 4.75% = −1.44. r was below g in 17 of the 24 years. The FY2021 mean was 1.66%; the monthly low was 1.556% (January 2022).
| Fiscal year | r, average rate (%) | g, nominal GDP growth (%) | r − g (points) |
|---|---|---|---|
| 2002 | 5.60 | 2.88 | 2.72 |
| 2003 | 4.92 | 4.15 | 0.77 |
| 2004 | 4.53 | 6.65 | −2.12 |
| 2005 | 4.60 | 6.75 | −2.14 |
| 2006 | 4.89 | 6.21 | −1.31 |
| 2007 | 5.04 | 4.90 | 0.14 |
| 2008 | 4.60 | 3.43 | 1.17 |
| 2009 | 3.64 | −2.23 | 5.87 |
| 2010 | 3.22 | 2.88 | 0.34 |
| 2011 | 2.98 | 3.91 | −0.93 |
| 2012 | 2.73 | 4.16 | −1.43 |
| 2013 | 2.48 | 3.59 | −1.11 |
| 2014 | 2.41 | 4.44 | −2.02 |
| 2015 | 2.36 | 4.22 | −1.86 |
| 2016 | 2.30 | 2.63 | −0.33 |
| 2017 | 2.26 | 3.94 | −1.68 |
| 2018 | 2.38 | 5.48 | −3.10 |
| 2019 | 2.56 | 4.16 | −1.60 |
| 2020 | 2.15 | 0.24 | 1.91 |
| 2021 | 1.66 | 8.00 | −6.34 |
| 2022 | 1.72 | 10.94 | −9.23 |
| 2023 | 2.59 | 7.17 | −4.58 |
| 2024 | 3.22 | 5.66 | −2.44 |
| 2025 | 3.31 | 4.75 | −1.44 |
Download SVG · CSV. Data and chart licensed CC BY 4.0.
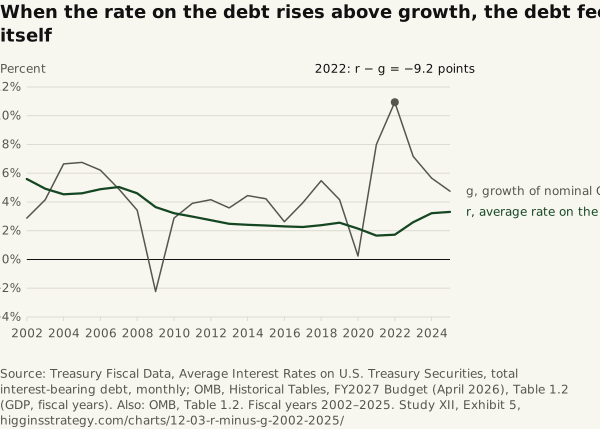
Higgins Strategy. “When the rate on the debt rises above growth, the debt feeds on itself” Exhibit 5, The Interest Bill (Study XII). October 12, 2026. https://higginsstrategy.com/charts/12-03-r-minus-g-2002-2025/