The bill more than doubled in five years; about 60% of the rise was higher rates
Source. Treasury Fiscal Data, Interest Expense on the Public Debt Outstanding (fiscal year to date at September 30) and Debt to the Penny (total public debt outstanding, September 30). Also: Treasury Fiscal Data, Debt to the Penny. Fiscal years 2021 and 2026, October–September.
Method and data
Method. Gross interest = debt × the effective rate (interest ÷ debt). FY2021: $562.4 billion ÷ $28,428.9 billion = 1.98%; FY2026: $1,360.4 billion ÷ $40,171.8 billion = 3.39% (both October–September). The midpoint method splits the $798.0 billion rise exactly: the debt effect is the change in debt times the mean of the two effective rates ($11,742.9 billion × 2.6823% = $315.0 billion); the rate effect is the change in rate times the mean debt (1.4082 points × $34,300.4 billion = $483.0 billion), 60.5% of the rise. Crediting the whole interaction to the rate gives 71%; crediting it to the debt, 50%.
| Item | Value | Unit |
|---|---|---|
| gross interest FY2021 | 562.4 | usd_billions |
| added by more debt (midpoint split) | 315 | usd_billions |
| added by higher effective rate (midpoint split) | 483 | usd_billions |
| gross interest FY2026 | 1360.4 | usd_billions |
| debt outstanding FY2021 | 28428.9 | usd_billions |
| debt outstanding FY2026 | 40171.8 | usd_billions |
| effective rate FY2021 (interest / debt) | 1.98 | percent |
| effective rate FY2026 (interest / debt) | 3.39 | percent |
| rate share of rise, midpoint split | 60.5 | percent |
| rate share if interaction credited to rate | 70.9 | percent |
| rate share if interaction credited to debt | 50.2 | percent |
Download SVG · CSV. Data and chart licensed CC BY 4.0.
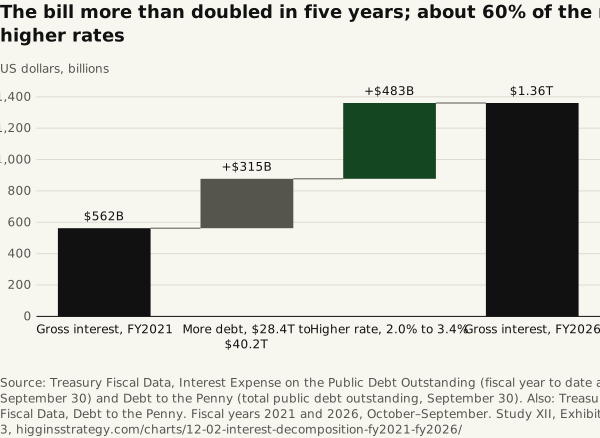
Higgins Strategy. “The bill more than doubled in five years; about 60% of the rise was higher rates” Exhibit 3, The Interest Bill (Study XII). October 12, 2026. https://higginsstrategy.com/charts/12-02-interest-decomposition-fy2021-fy2026/