Rolled over, the interest equals the checks in year 21
Source. Treasury Fiscal Data, Average Interest Rates on U.S. Treasury Securities, total interest-bearing debt, August 2026 (3.49%); FRED, 10-year Treasury constant-maturity yield, October 1, 2026 (5.24%). Also: FRED, DGS10, via ALFRED. Years 0–30 after the payment.
Method and data
Method. Cumulative interest = principal × ((1 + rate)^year − 1), compounded annually: the interest is borrowed each year, as it has been every year since 2002, and the rate is held constant; not a forecast. On $1,597.7 billion at 3.49%: $653.8 billion by year 10, $1,575.2 billion by year 20 ($4,596 per resident), $2,873.7 billion by year 30. The multiples and the adult check’s total cost at 3.49% and 5.24% feed Exhibits 19 and 20.
| Year | Interest on $1.60T at 3.49% ($bn) |
|---|---|
| 0 | 0.0 |
| 1 | 55.8 |
| 2 | 113.5 |
| 3 | 173.2 |
| 4 | 235.0 |
| 5 | 298.9 |
| 6 | 365.1 |
| 7 | 433.6 |
| 8 | 504.5 |
| 9 | 577.9 |
| 10 | 653.8 |
| 11 | 732.4 |
| 12 | 813.7 |
| 13 | 897.9 |
| 14 | 985.0 |
| 15 | 1,075.1 |
| 16 | 1,168.4 |
| 17 | 1,264.9 |
| 18 | 1,364.8 |
| 19 | 1,468.2 |
| 20 | 1,575.2 |
| 21 | 1,686.0 |
| 22 | 1,800.6 |
| 23 | 1,919.2 |
| 24 | 2,041.9 |
| 25 | 2,168.9 |
| 26 | 2,300.4 |
| 27 | 2,436.4 |
| 28 | 2,577.2 |
| 29 | 2,722.9 |
| 30 | 2,873.7 |
Download SVG · CSV. Data and chart licensed CC BY 4.0.
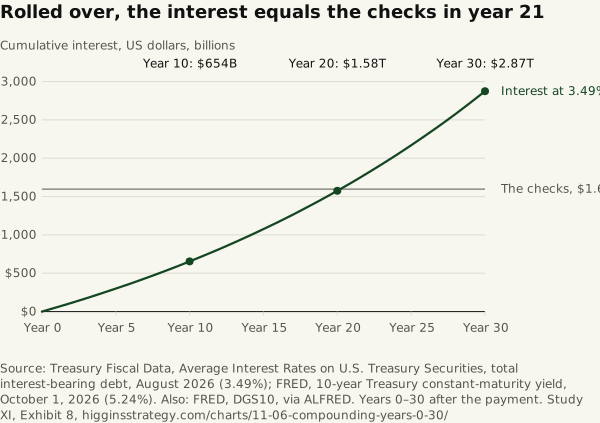
Higgins Strategy. “Rolled over, the interest equals the checks in year 21” Exhibit 8, Five Thousand Dollars Each (Study XI). October 12, 2026. https://higginsstrategy.com/charts/11-06-compounding-years-0-30/