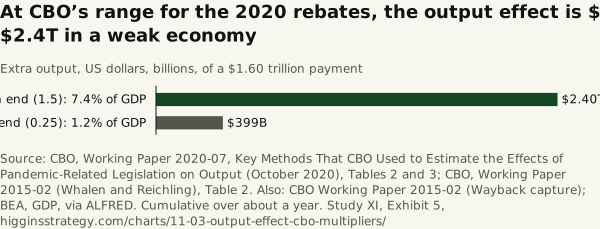
At CBO’s range for the 2020 rebates, the output effect is $0.4T to $2.4T in a weak economy
Source. CBO, Working Paper 2020-07, Key Methods That CBO Used to Estimate the Effects of Pandemic-Related Legislation on Output (October 2020), Tables 2 and 3; CBO, Working Paper 2015-02 (Whalen and Reichling), Table 2. Also: CBO Working Paper 2015-02 (Wayback capture); BEA, GDP, via ALFRED. Cumulative over about a year.
Method and data
Method. CBO’s range for the 2020 recovery rebates, in a weak economy with the Fed on hold (“when output is well below potential and the Federal Reserve’s responses are limited”): a direct effect of 0.50–0.60 per dollar (Table 3) times a demand multiplier of 0.5–2.5 over four quarters (Table 2) = 0.25–1.5 dollars of output per dollar. × $1,597.7 billion = $399.4 billion to $2,396.5 billion, 1.2% to 7.4% of GDP (2026 Q2, annual rate). At full employment CBO’s multipliers are about a third as large: 0.17–0.83 per dollar of demand over eight quarters, against 0.5–2.5 when output is well below potential (Working Paper 2015-02, Table 2; the ratio is a calculation). Not a forecast.
| End of the range | Output per dollar | On $1.60T ($bn) | Share of GDP (%) | On $1.23T ($bn) |
|---|---|---|---|---|
| High end (1.5) | 1.50 | 2,396.5 | 7.4 | 1,839.6 |
| Low end (0.25) | 0.25 | 399.4 | 1.2 | 306.6 |
Download SVG · CSV. Data and chart licensed CC BY 4.0.
Higgins Strategy. “At CBO’s range for the 2020 rebates, the output effect is $0.4T to $2.4T in a weak economy” Exhibit 5, Five Thousand Dollars Each (Study XI). October 12, 2026. https://higginsstrategy.com/charts/11-03-output-effect-cbo-multipliers/